One-Dimensional Kinematics Review
Navigate to:
Review Session Home - Topic Listing
1D Kinematics - Home ||
Printable Version ||
Questions and Links
Answers to Questions:
#1-7 ||
#8-#28 ||
#29-#42 ||
#43-#50
[ #29 | #30 | #31 | #32 | #33 | #34 | #35 | #36 | #37 | #38 | #39 | #40 | #41 | #42 ]
Part C: Diagramming
29. On the diagrams below, construct a dot diagram representing the motion of an object with a ... .
- constant rightward velocity
- rightward velocity and a rightward acceleration
- rightward velocity and a leftward acceleration
- rightward velocity, first slow and constant, and then accelerating to a high speed
- rightward velocity, first decelerating from a high speed to a rest position, then maintaining the rest position, and finally accelerating at a lower rate than the initial deceleration.


Answer: See diagram above; explanations are given below.
a. A constant velocity is depicted by dots which are spaced the same distance apart.
b. An object which is accelerating in the same direction as the velocity (both are rightward in this case) is speeding up. And so as you trace your eye from left to right across the diagram (rightward), the dots should be spaced further and further apart to indicate that the object is speeding up.
c. An object that moves rightward (i.e., rightward velocity) and accelerating leftwards must be slowing down. And so as you trace your eye from left to right across the diagram (rightward), the dots should be spaced closer and closer together to indicate that the object is slowing down.
d. The dots begin by being equally spaced (constant speed) and close together (slow); then the spacing between dots become gradually further and further apart to indicated the speeding up nature of the motion.
e. The object is moving rightwards so you will need to trace your eye from left to right across the diagram (rightward). As you do you will note that the dots become closer and closer to indicate that the object is slowing down. Then the dots are piled onto the same location to indicate that the object is at rest. Finally, the dots are spread further and further apart; the rate at which the distance between dots is very gradual - consistent with the statement that the rate of acceleration is less than the original rate of deceleration.
[ #29 | #30 | #31 | #32 | #33 | #34 | #35 | #36 | #37 | #38 | #39 | #40 | #41 | #42 ]
30. On a dot diagram, how does the motion of an object moving to the right and slowing down differ from an object moving to the left and speeding up? Explain.
Answer: There is no difference!
The two diagrams would be indistinguishable from each other as indicated by the following two diagrams.

There are two ways to accelerate leftward; and regardless of how it happens, the oil drop trace would be identical. A leftward acceleration is a leftward acceleration.
[ #29 | #30 | #31 | #32 | #33 | #34 | #35 | #36 | #37 | #38 | #39 | #40 | #41 | #42 ]
Part D: Kinematic Graphing
31. On the position-time graph below, sketch a plot representing the motion of an object which is ... . Label each line with the corresponding letter (e.g., "a", "b", "c", etc.)
- at rest.
- moving in the positive direction with constant speed
- moving in the negative direction and speeding up
- moving in the positive direction and slowing down
- moving in the positive direction at a constant speed (slow) and then later fast at constant speed
- moving with a negative velocity and a negative acceleration
- moving with a negative velocity and a positive acceleration
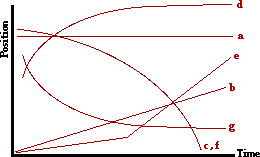
Answer: See diagram above; explanations are given below.
The governing principle in this problem is that the slope of a position-time graph is equal to the velocity of the object.
a. An object at rest (v = 0 m/s) is represented by a line with 0 slope (horizontal line).
b. An object with a constant, positive velocity is represented by a straight line (constant slope) which slopes upward (positive slope).
c. An object moving in the - direction and speeding up is represented by a line which slopes downward (- slope) and increases its steepness (increasing slope).
d. An object moving in the + direction and slowing down is represented by a line which slopes upward (+ slope) and increases its steepness (increasing slope).
e. An object moving in the positive direction at constant speed would be represented by a straight diagonal line (constant speed) which slopes upward (+ velocity). So in this case, there will be two straight diagonal lines; the second line will slope more than the first line.
f. An object moving in the negative direction with negative acceleration is speeding up (since the a vector is in the same direction as the motion). So on a p-t graph, this object will be represented by a line which slopes downwards (- velocity) and increases its slope over time (speeding up).
g. An object moving in the negative direction with positive acceleration is slowing down (since the a vector is in the opposite direction as the motion). So on a p-t graph, this object will be represented by a line which slopes downwards (- velocity) and levels off or becomes more horizontal over time (slowing down).
[ #29 | #30 | #31 | #32 | #33 | #34 | #35 | #36 | #37 | #38 | #39 | #40 | #41 | #42 ]
32. On the velocity-time graph below, sketch a plot representing the motion of an object which is ... . Label each line with the corresponding letter (e.g., "a", "b", "c", etc.)
- at rest
- moving in the positive direction at constant speed
- moving in the negative direction from slow to fast
- moving in the negative direction from fast to slow
- moving with a positive velocity and a positive acceleration
- moving with a positive velocity and a negative acceleration
- moving with a positive velocity at constant speed and then decelerating to a rest position
- moving in the positive direction while slowing down, changing directions and moving in the negative directions while speeding up
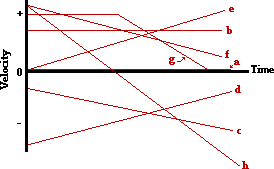
Answer: See diagram above; explanations are given below.
The governing principle in this problem is that the slope of a velocity-time graph is equal to the acceleration of the object. Furthermore, a negative velocity would be a line plotted in the negative region of the graph; a positive velocity would be a line plotted in the positive region of the graph.
a. An object at rest (v = 0 m/s) is represented by a line located on the time axis (where v = 0 m/s).
b. An object moving in the positive direction at constant speed will be represented on a v-t graph by a horizontal line (slope = a = 0 m/s/s) positioned in the + velocity region.
c. An object moving in the negative direction and speeding up will be represented on a v-t graph by a sloped line located in the - velocity region. Since such an object has a - acceleration, the line will slope downwards (- acceleration).
d. An object moving in the negative direction and slowing down will be represented on a v-t graph by a sloped line located in the - velocity region. Such an object has a positive acceleration (since it is slowing down, the a vector will be in the opposite direction of the motion). The + acceleration would be consistent with a line that slopes upwards.
e. An object moving with a + velocity and a + acceleration would be represented on a v-t graph by a sloped line located in the + velocity region. The + acceleration would be consistent with a line that slopes upwards.
f. An object moving with a + velocity and a - acceleration would be represented on a v-t graph by a sloped line located in the + velocity region. The - acceleration would be consistent with a line that slopes downwards.
g. An object moving with a constant + velocity would be represented on a v-t graph by a horizontal line (slope = a = 0 m/s/s) located in the + velocity region. The slowing down to rest portion of the graph would be represented by a line which slopes downwards (- acceleration) towards the time axis.
[ #29 | #30 | #31 | #32 | #33 | #34 | #35 | #36 | #37 | #38 | #39 | #40 | #41 | #42 ]
33. Consider the position-time plots below. Sketch the shape of the corresponding velocity-time graphs.

Answer: See diagram above; explanations are given below.
In the top graph, the object moves in the + direction with an acceleration from fast to slow until it finally stops. Then the object remains at rest. This means there is a positive velocity and a negative acceleration; the final velocity of the object is 0 m/s. So on a v-t graph, the line needs to be in the +velocity region and the slope needs to be - (for a negative acceleration). The line should end on the v=0 m/s axis (corresponding to its final rest position).
In the bottom graph, the object is moving in the - direction with a constant speed. It then gradually slows down until it stops; it then remains at rest. So on a v-t graph, there should be a horizontal line (a=0 m/s/s) in the -velocity region of the graph. Then the line should slope upwards (for the + acceleration that is characteristic of objects moving in the - direction and slowing down). The line should end on the v=0 m/s axis (corresponding to its final rest position).
[ #29 | #30 | #31 | #32 | #33 | #34 | #35 | #36 | #37 | #38 | #39 | #40 | #41 | #42 ]
34. Consider the velocity-time plots below. Sketch the shape of the corresponding position-time graphs.
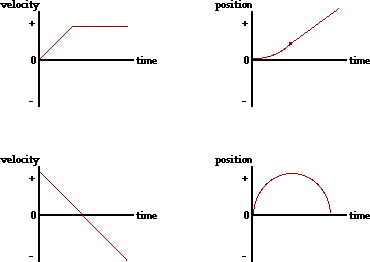
Answer: See diagram above; explanations are given below.
In the top graph, the object moves in the + direction with an acceleration from slow to fast. Then the object maintains a constant speed by walking in the same direction (+ direction). On a p-t graph, this would correspond to a line with positive slope (for moving in the + direction) which eventually straightens out into a diagonal line with constant slope (constant speed) in the positive direction (positive velocity).
In the bottom graph, the object is moving in the + direction and slowing down from a high speed to a slow speed until it finally changes direction; the object then moves in the - direction and speeds up. On a p-t graph, this would correspond to a line with positive slope (for moving in the + direction) which gradually levels off to a horizontal (for slowing down); then the line begins to slope downwards (for moving in the - direction) and gradually becomes steeper and steeper (for speeding up).
[ #29 | #30 | #31 | #32 | #33 | #34 | #35 | #36 | #37 | #38 | #39 | #40 | #41 | #42 ]
The velocity-time graph below depicts the motion of an automobile as it moves through Glenview during rush hour traffic. Use the graph to answer questions #35 - #39.
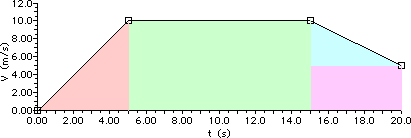
35. Determine the displacement of the automobile during the following intervals of time. PSYW
Answer: See diagram above and calculations below.
Use area calculations to determine the displacement of the object.
|
t = 0 s - 5 s
|
t = 5 s - 15 s
|
t = 15 s - 20 s
|
|
Area of the pink triangle:
A = 0.5*b*h
A = 0.5*(5 s)*(10 m/s)
A = 25 m
|
Area of the green rectangle:
A = b*h
A = (10 s)*(10 m/s)
A = 100 m
|
Area of the blue triangle
plus purple rectangle:
A = 0.5*b1*h1 + b2*h2
A = 0.5*(5 s)*(5 m/s) + (5 s)*(5 m/s)
A = 12.5 m + 25 m
A = 37.5 m
|
[ #29 | #30 | #31 | #32 | #33 | #34 | #35 | #36 | #37 | #38 | #39 | #40 | #41 | #42 ]
36. Determine the velocity of the automobile at the following instant(s) in time.
Answer: See calculations below.
It is a velocity graph; so merely read the velocity values off the graph.
|
t = 3 s
|
t = 8 s
|
t = 17 s
|
|
v = 6.0 m/s
|
v = 10.0 m/s
|
v = 8.0 m/s
|
[ #29 | #30 | #31 | #32 | #33 | #34 | #35 | #36 | #37 | #38 | #39 | #40 | #41 | #42 ]
37. Determine the acceleration of the automobile during the following intervals of time.
Answer: See calculations below.
Do slope calculations to determine the acceleration. Slope is rise/run.
|
t = 0 s - 5 s
|
t = 5 s - 15 s
|
t = 15 s - 20 s
|
|
a = slope = rise/run
a = (10 m/s)/(5 s)
a = 2.0 m/s/s
|
a = slope = rise/run
a = (0 m/s)/(10 s)
a = 0.0 m/s/s
|
a = slope = rise/run
a = (-5 m/s)/(5 s)
a = -1.0 m/s/s
|
[ #29 | #30 | #31 | #32 | #33 | #34 | #35 | #36 | #37 | #38 | #39 | #40 | #41 | #42 ]
38. Using complete sentences and the language of physics, describe the motion of the automobile during the entire 20.0 seconds. Explicitly describe any changes in speed or direction which might occur; identify intervals of time for which the automobile is at rest, the automobile is moving with constant speed, or the automobile is accelerating.
Answer:
During the first 5 seconds, the auto is moving with a + velocity and a + acceleration, increasing its speed from slow to fast. From 5 s to 15 s, the auto is moving with a constant speed and a zero acceleration. From 15 s to 20 s, the auto is moving with a +velocity and a - acceleration, decreasing its speed from fast to slow.
[ #29 | #30 | #31 | #32 | #33 | #34 | #35 | #36 | #37 | #38 | #39 | #40 | #41 | #42 ]
39. Supposing the automobile has an oil leak, demonstrate your understanding of its motion by drawing an oil drop diagram for the 20.0 seconds of motion. Divide the diagram into three distinct time intervals (0.0 - 5.0 seconds, 5.0 - 15.0 seconds, 15.0 - 20.0 seconds).
Answer: See Diagram and explanation below.
In the first five seconds, the object is speeding up so the spacing between dots will gradually increase. In the next ten seconds (5-15 s) the object is maintaining a constant velocity so the spacing between dots remains the same. In the last 5 seconds (15-20 s) the object is slowing down so the spacing between dots is gradually decreasing.

[ #29 | #30 | #31 | #32 | #33 | #34 | #35 | #36 | #37 | #38 | #39 | #40 | #41 | #42 ]
40. For the plots below, determine the velocity of the object ... .
|
a. from 0.0 - 5.0 seconds
|
b. from 5.0 - 10.0 seconds
|
c. at 13.0 seconds
|
|

|

|

|
Answer: See explanations and calculations below.
For a position-time graph, the velocity is determined from a slope calculation. So in each case, two points must be picked and slope calculation must be performed.
a. Pick the two points: (0 s, 20 m) and (5 s, 10 m)
slope = rise/run = (-10 m)/(5 s) = -2.0 m/s
b. Pick the two points: (5 s, 2 m) and (10 s, 6 m)
slope = rise/run = (4 m)/(5 s) = +0.80 m/s
c. From 0 to 20 s, the slope is a constant value. So determining the slope at 13 seconds is as simple as merely determining the slope of the line choosing any two points. So just pick the two points: (0 s, 10 m) and (20 s, 50 m)
slope = rise/run = (40 m)/(20 s) = +2.0 m/s
[ #29 | #30 | #31 | #32 | #33 | #34 | #35 | #36 | #37 | #38 | #39 | #40 | #41 | #42 ]
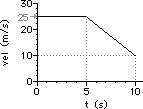
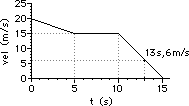
41. For the plots below, determine the acceleration of the object ... .
|
a. from 0.0 - 5.0 seconds
|
b. from 5.0 - 10.0 seconds
|
c. at 13.0 seconds
|
|

|
|
|
Answer: See explanations and calculations below.
For a velocity-time graph, the acceleration is determined from a slope calculation. So in each case, two points must be picked and slope calculation must be performed.
a. Pick the two points: (0.0 s, 5.0 m/s) and (5.0 s, 30.0 m/s)
slope = rise/run = (25.0 m/s)/(5.0 s) = +5.0 m/s2
b. Pick the two points: (5.0 s, 25.0 m/s) and (10.0 s, 10.0 m/s)
slope = rise/run = (-15 m/s)/(5.0 s) = -3.0 m/s2
c. From 10.0 to 15.0 s, the slope is a constant value. So determining the slope at 13 seconds is as simple as merely determining the slope of the line choosing any two points. So just pick the two points: (10.0 s, 15.0 m/s) and (15.0 s, 0.0 m/s)
slope = rise/run = (-15.0 m/s)/(5.0 s) = -3.0 m/s
[ #29 | #30 | #31 | #32 | #33 | #34 | #35 | #36 | #37 | #38 | #39 | #40 | #41 | #42 ]
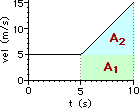
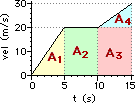
42. For the plots below, determine the displacement of the object ... .
|
a. from 0.0 - 5.0 seconds
|
b. from 5.0 - 10.0 seconds
|
c. from 0.0 - 15.0 seconds
|
|

|
|
|
Answer: See explanations and calculations below.
For velocity-time graphs, the displacement of an object is found by computing the area between the line and the time axis. The shape is typically a rectangle (area = base*height), a triangle (area = 0.5*base*height) or a trapezoid (which can typically be transformed into a rectangle and a triangle or the area can be computed as 0.5*(h1 + h2)*base).
a. Area = 0.5*base*height = 0.50*(5.0 s)*(20.0 m/s) = 50. m
b. Area = A1 + A2 (see diagram) = (5.0 s)*(5.0 m/s) + 0.50*(5.0 s)*(10.0 m/s) = 25 m + 25 m = 50. m
c. Area = A1 + A2 + A3 + A4 (see diagram)
Area = 0.5*(5.0 s)*(20.0 m/s) + (5.0 s)*(20.0 m/s) + (5.0 s)*(20.0 m/s) + 0.5*(5.0 s)*(10.0 m/s)
Area = 50 m + 100 m + 100 m + 25 m = 275 m
[ #29 | #30 | #31 | #32 | #33 | #34 | #35 | #36 | #37 | #38 | #39 | #40 | #41 | #42 ]
Navigate to Answers for:
Review Session Home - Topic Listing
1D Kinematics - Home ||
Printable Version ||
Questions and Links
Answers to Questions:
#1-7 ||
#8-#28 ||
#29-#42 ||
#43-#50
You Might Also Like ...
Users of The Review Session are often looking for learning resources that provide them with practice and review opportunities that include built-in feedback and instruction. If that is what you're looking for, then you might also like the following:
- The Calculator Pad
The Calculator Pad includes physics word problems organized by topic. Each problem is accompanied by a pop-up answer and an audio file that explains the details of how to approach and solve the problem. It's a perfect resource for those wishing to improve their problem-solving skills.
Visit: The Calculator Pad Home | Calculator Pad - Kinematics
- Minds On Physics the App Series
Minds On Physics the App ("MOP the App") is a series of interactive questioning modules for the student that is serious about improving their conceptual understanding of physics. Each module of the series covers a different topic and is further broken down into sub-topics. A "MOP experience" will provide a learner with challenging questions, feedback, and question-specific help in the context of a game-like environment. It is available for phones, tablets, Chromebooks, and Macintosh computers. It's a perfect resource for those wishing to refine their conceptual reasoning abilities. Part 1 of the series includes Kinematic Concepts and Kinematic Graphing.
Visit: MOP the App Home || MOP the App - Part 1