A dot diagram displays the position of an object at constant intervals of time. The spacing between adjacent dots reveals the distance traveled during that interval of time. A larger distance between adjacent dots is an indication of a faster-moving object; a smaller distance is an indication of a slower-moving object.
Getting your Trinity Audio player ready...
Hold down the T key for 3 seconds to activate the audio accessibility mode, at which point you can click the K key to pause and resume audio. Useful for the Check Your Understanding and See Answers.
Position-Time Graphs - Conceptual Analysis - help11
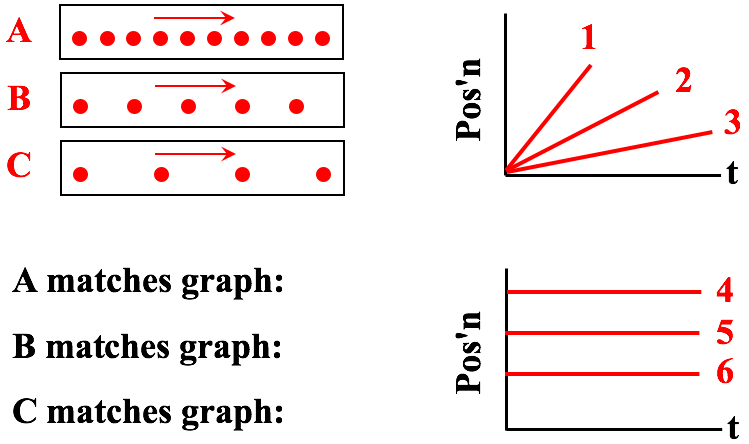
There are three very similar versions of this question. Each version provides three dot diagrams for three different ojects. The question asks the learner to match one of six lines on a position-time graph to the corresponding dot diagram. One of the versions is shown below.
Version 1
Consider the dot diagrams below for Objects A, B, and C. The arrow represents the direction of travel. Match the motion of Objects A, B, and C to one of the lines on the graph.
Try the links below to our Tutorial for more information about position-time graphs:
The Meaning of Shape for a p-t Graph
The Meaning of Slope for a p-t Graph
Determining the Slope on a p-t Graph