When an electron in an excited state energy level jumps or transitions downward to a lower energy level, it emits electromagnetic radiation ("light") with a given energy. The energy value is equal to the difference in energy between the two energy levels. If the energy falls within the range of the visible light spectrum, then a line will be visible on the spectrum for that element. The color of the line is related to the energy change of the electron.
Getting your Trinity Audio player ready...
Hold down the T key for 3 seconds to activate the audio accessibility mode, at which point you can click the K key to pause and resume audio. Useful for the Check Your Understanding and See Answers.
Line Spectra - help7
There are four questions in this Question Group. Each question is very similar to one another. The question below is one of the questions.
Version 1: The energy level diagram for Element X shows the ground state and excited states E1, E2, and E3. The line spectra for this element displays three visible emission lines - violet, green, and red. The lines correspond to the electron transitions indicated below. Based on the properly-scaled energy levels shown in the diagram, match the three colors to the corresponding transitions.
e-Transition from E3 to E2: ___________
e-Transition from E2 to E1: ___________
e-Transition from E2 to Ground: ___________
Finally, the transition from E3 to Ground state would not be visible since it would correspond to the emission of ...
Electrons exist in quantized energy states. Only certain energy values are allowed within an atom. An electron can transition from a ground state to an excited state if it absorbs energy. Once in the excited state, it can transition back downward toward the ground state energy level in a single step or by multiple transitions. Each transition to a lower energy state results in the release of energy in the form of a photon. These photons are detectable as light and often fall within the range of the visible light spectrum. If the light falls in the visible light region of the electromagnetic spectrum, then it will be perceived as a colored line on a line spectrum.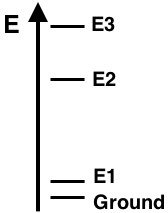 The energy of the emitted photon depends upon the difference in energy between the two states from and to which the electron transitioned. An energy level diagram depicts the relative energy values of the ground state and excited states. As can be seen, the energy differences vary depending on the initial and final state of the electron transition. For instance, the transition from E1 to the Gound state is a low energy transition and would result in the release of a low energy photon. On the other hand, the transition from E3 to the Ground state is a high energy transition and would result in the release of a high energy photon. The diagram allows you to compare the relative energies of a photon released for any given energy level transition.
The colors of the visible light spectrum are often remembered by the acronym ROYGBIV. Each letter of the acromym represents a color - red, orange, yellow, green blue, indigo, and violet. Every color of the visible light spectrum is associated with a wavelength, frequency and energy. These values are much different for red light as they are for violet light.
The colors of he visible light spectrum are organized in order of their energy. The lowest energy light waves are associated with red light. Knowing the pattern by which energy changes for the various colors of the ROYGBIV spectrum is the key to success in this question. You can inspect the energy level diagram and order the three given transitions from low energy to high energy. Then you can assign the color closest to violet to the high energy and the color closest to red to the low energy.
The fourth question demands that you analyze a fourth energy transition that does not correspond to an energy value within the visible light spectrum. Instead, the transition results in the release of an infrared photon or an ultraviolet photon. Inspect the diagram and determine if the relative energy change for this fourth transition is a large energy change or a small energy change. A small energy change would have an energy value less than red and would fall into the infrared range. On the other hand, a large energy change would have an energy value greater than violet and would fall into the ultraviolet range.