About Velocity-Time Graphs
A velocity-time graph displays information about how the velocity of an object changes over a span of time. There is typically a positive region of the graph, a negative region of the graph, and a v=0 line (time axis). It is important to give attention to where the plotted line is located relative to v=0 at any given time. If the line is above v=0 (in the + region), the object represented by the graph is moving in the positive direction (usually defined as rightward). And if the line is below v=0 (in the - region), the object is moving in the negative direction (usually defined as leftward). The further that the object is from the v=0 line, the faster that it is moving. So when the line moves further from the time axis, you will know that the object is moving faster. When saying "further from the time axis", we mean getting higher in the + region and lower in the - region of the graph. The time at which the plotted line crosses the v=0 mark is the time at which the object's speed is momentarily 0 m/s and it is in the process of changing its direction.
The Speed of the Pendulum Bob
As a pendulum bob swings to-and-fro, its speed and direction undergo repeated changes. The fastest speed occurs the moment the bob passes the resting position. A zero speed is experienced when the pendulum bon reaches its highest position. It is at these highest positions that the pendulum bob changes its direction of motion from moving to the right back towards the left (or vice versa). As a pendulum bob swings from its highest position back towards the resting position, it increases its speed. And as the bob swings from its lowest resting position upward towards the highest position, it decreases its speed. These changes occur over and over again in repeated and periodic fashion.
Advice for Connecting the Graph to the Location of the Bob
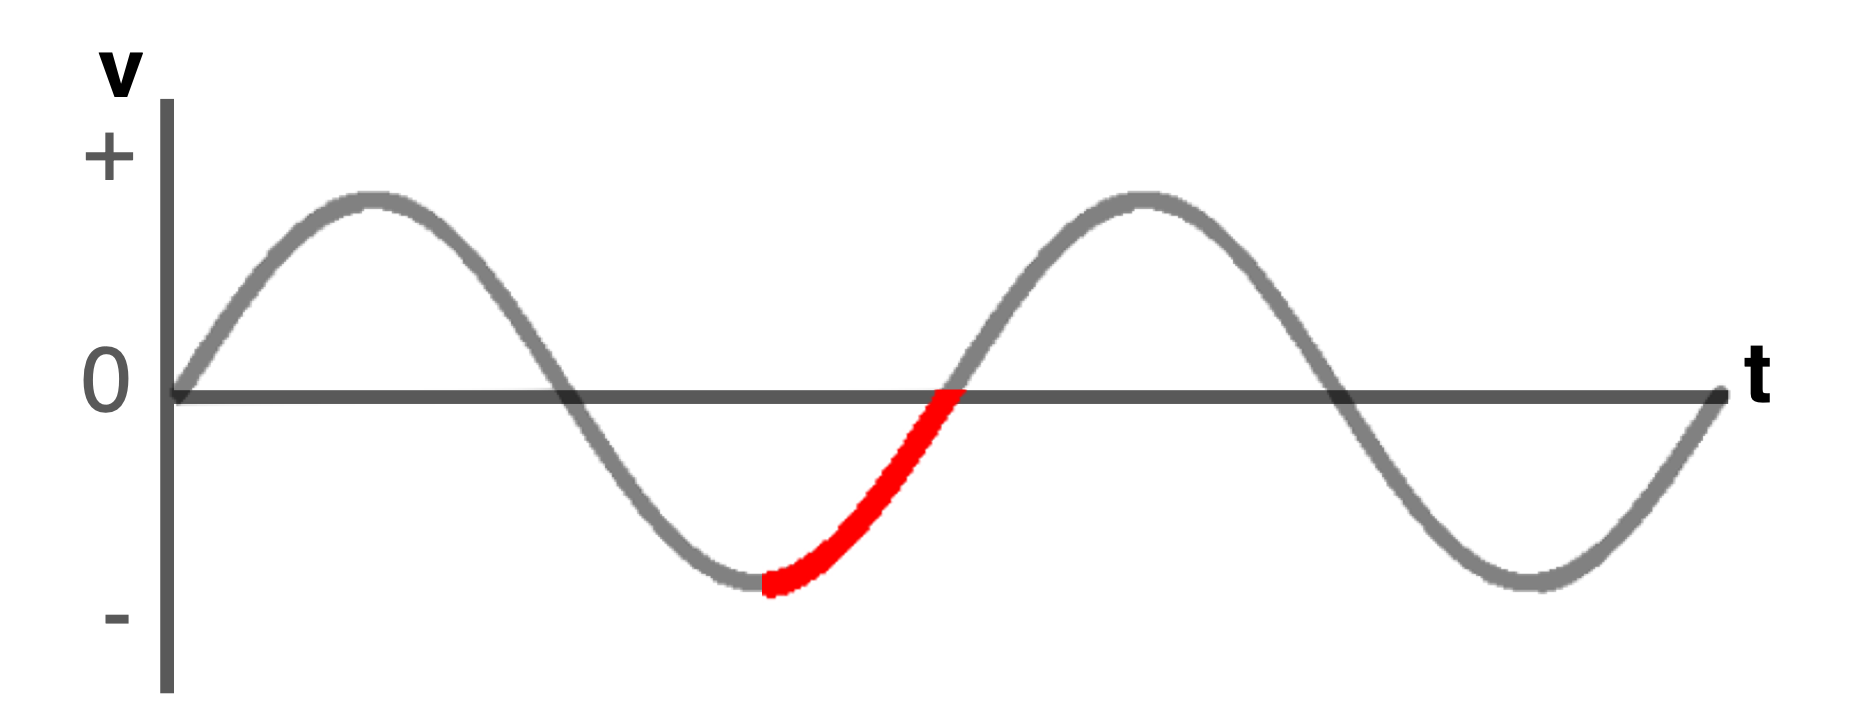
The task of connecting a section of the graph to a section of the trajectory can be difficult. The task is made easier if you approach it in a systematic manner with an understanding of the previous two paragraphs on this page. We recommend first analyzing the red-shaded section of the graph in an effort to determine what the graphs "says" about the motion. Does the graph show an increasing speed, a decreasing speed motion, or a combination of first increasing and then decreasing its speed? And does the graph show an object with a positive velocity (moving to the right) or a negative velocity (moving to the left)? Use the information in the About Velocity-Time Graphs sections to assist with this.
Once you have determined how the graph describes the motion, make an effort to determine which part of the pendulum's path matches such a description. If the graph represents a decreasing speed motion, then along what parts of the path would the pendulum bob be decreasing its speed (slowing down)? There will be two possibilities and you will be able to isolate the correct answer from the two possibilities by using information about the direction of motion (+ or -). And if the graph describes an increasing speed motion, then along what parts of the path would the pendulum bob be increasing its speed (speeding up)? Once again there will be two possibilities and you will be able to determine the correct answer using direction information.
Approaching the matching task in this two-step fashion will yield best results. You got this!
 A pendulum is swinging back and forth along its circular arc. Five locations along its path are shown. A plot of its velocity as a function of time is shown. A positive velocity represents a pendulum bob moving to the right; a negative velocity represents a leftward motion.