Identify what type of motion is being described by the postion-time graph. This includes deciding whether the graph describes a constant speed, a speeding up, or a slowing down motion. It also includes deciding whether the graph describes an object moving with a positive or a negative velocity. Then determine how such features of an object's motion are represented on a velocity-time graph. Finally, identify the velocity-time graph that has these features.
Match That Graph - Questions 6 Help
This question provides a position-time graph ....
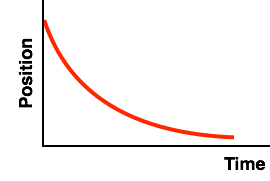
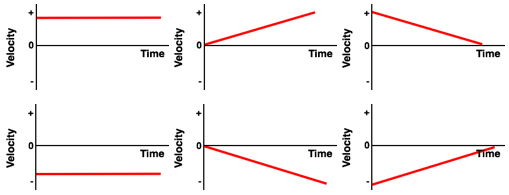
... and asks the learner to identify the corresponding velocity-time graph:
The slope of a position-time graph reveals information about the object's velocity - its speed and direction of motion. A positive slope indicates a positive velocity and a negative slope indicates a negative velocity. If the line is straight - i.e., has constant slope - then the object is moving with a constant speed. But if the line curves in such a manner as to become steeper and steeper over the course of time, then the object is speeding up. And if the line curves in such a manner as to become less and less steep over the course of time, then the object is slowing down.
Use the above principles to decide whether the motion described by this position-time graph is a speeding up, slowing down or a constant speed motion. Also decide if the velocity is positive or negative. You might want to write down what you decide.

Now your goal is to determine which of the six velocity-time graphs describe the same motion. On a velocity-time graph, a positive velocity is indicated by a line located in the positive region (above the time axis) and a negative velocity is indicated by a line in the negative region (below the time axis). This information reduces the number of possible options to three graphs.
On a velocity-time graph, a constant speed motion is a horizontal line. Changing speed motions are represented by diagonal lines. If the diagonal line approaches the time axis (either from above or below), then the motion is a slowing down motion. On the other hand, if the diagonal line gets further and further from the time axis, then the motion is a speeding up motion. Using what you have determined about the motion from the position-time graph, you can now pick the matching velocity-time graph.