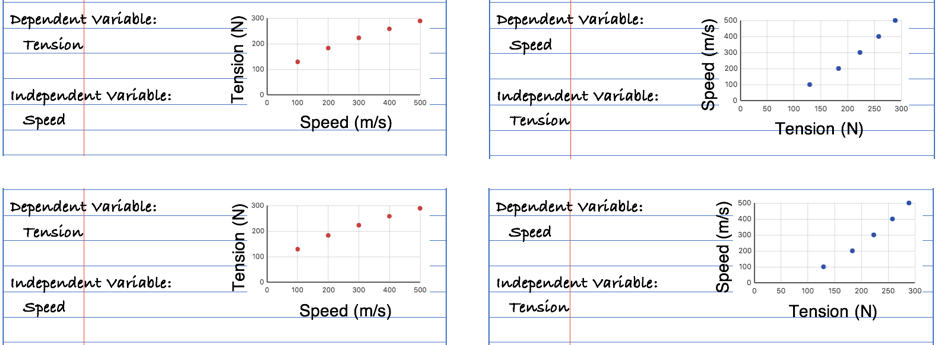
Experiments are commonly performed in order to determine the effect of one variable (the independent variable) upon another variable (the dependent variable). Once the data have been collected, it is a standard procedure to represent the data in an x-y plot. The dependent variable values are plotted along the y-axis and the independent variable values are plotted along the x-axis.
Experiments and Variables - Questions 11 Help
There are several versions of this question that differ only in terms of the randomized order of the answer options. Here is one of those versions:
Version 1:
Stan Dingwaives and Anna Conda are conducting a study of the effect of varying tension in a wire upon the speed of wave traveling through the wire. Which notebook entry accurately identifies the variables and displays the best choice for a plot?
Sorry. We're pedaling as fast as we can but as of this writing we do not have any Tutorial information on the topic of experimentation and variables.