About the Science Reasoning Center
 Highly Recommended
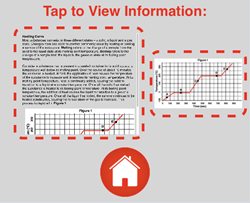
Like all our Science Reasoning Center activities, the completion of the Heating Curves activity requires that a student use provided information about a phenomenon, experiment, or data presentation to answer questions. This information is accessible by tapping on the small thumbnails found on the bottom right of every question. However, it may be considerably easier to have a printed copy of this information or to display the information in a separate browser window. You can access this information from this page.
The Standards
The Heating Curves task describes the state changes that occur in a sample of matter as it is heated from a temperature below its melting point to a temperature above its boiling point in a closed container. In addition to the two paragraphs describing the state changes, a heating curve graph is included. Questions target a student's ability to use the model presented in the body of text to interpret the graph, to connect information in the body of text to the graph, and to compare various points on the graph to one another in terms of the state of matter that is present and the process (state change or temperature increase) that is occurring.
Success with the task requires some degree of proficiency with respect to ...
- Developing and Using Models (Science and Engineering Practice 2.3)
Develop, revise, and/or use a model based on evidence to illustrate and/or predict the relationships between systems or between components of a system. - Developing and Using Models (Science and Engineering Practice 2.6)
Develop and/or use a model (including mathematical and computational) to generate data to support explanations, predict phenomena, analyze systems, and/or solve problems. - Systems and System Models (Crosscutting Concept 4.1)
When investigating or describing a system, the boundaries and initial conditions of the system need to be defined and their inputs and outputs analyzed and described using models. - Stability and Change (Crosscutting Concept 7.1)
Much of science deals with constructing explanations of how things change and how they remain stable.
While Heating Curves addresses the two NextGen Science and Engineering Practices and the two Crosscutting Concepts above, the activity drew its greatest inspiration from ACT's College Readiness Standards for Science Reasoning. The activity consists of 47 questions organized into 12 Question Groups that are spread across the three activities. The questions target a single strand (Evaluation of Models, Inferences, and Experimental Results - EMI) of the College Readiness Standards. The two main standards that are addressed are ...
EMI 401:
Determine which simple hypothesis, prediction, or conclusion is, or is not, consistent with a data presentation, model, or piece of information in text.
EMI 501:
Determine which simple hypothesis, prediction, or conclusion is, or is not, consistent with two or more data presentations, models, and/or pieces of information in text
Complementary and Similar Resources
The following resources at The Physics Classroom website complement the Heating Curves Science Reasoning Activity. Teachers may find them useful for supporting students and/or as components of lesson plans and unit plans.
Physics Classroom Tutorial, Thermal Physics Chapter: What Does Heat Do?
Concept Builders, Thermal Chemistry and Thermodynamics: Measuring the Quantity of Heat
The Calculator Pad, Thermal Chemistry and Thermodynamics, Problem Sets TC2 and TC3
Recommended: Print Passage, Tables, and Graphs
Also see: