Interactive - Sound Waves
Explore the nature of a wave and the relationship between waves and sound with the Simple Wave Simulator.
Activities
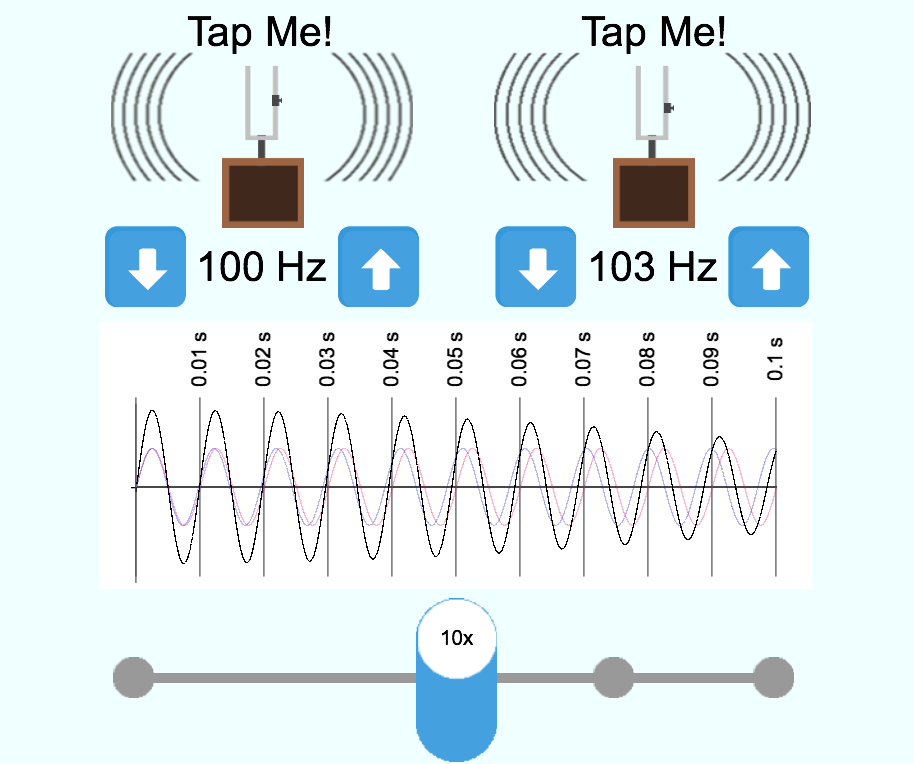
Beat Patterns
If you have ever tried to tune an instrument, you likely used the phenomenon of beats. Or if you've observed the orchestra attempting to tune their instruments to one another, you likely observed them utilizing beats. Just exactly what is the concept of beats? And what physics is involved in beats? In this Interactive, you will use two virtual tuning forks to explore the answers to these questions. Give them a tap, set them into vibrations, and observe the result.
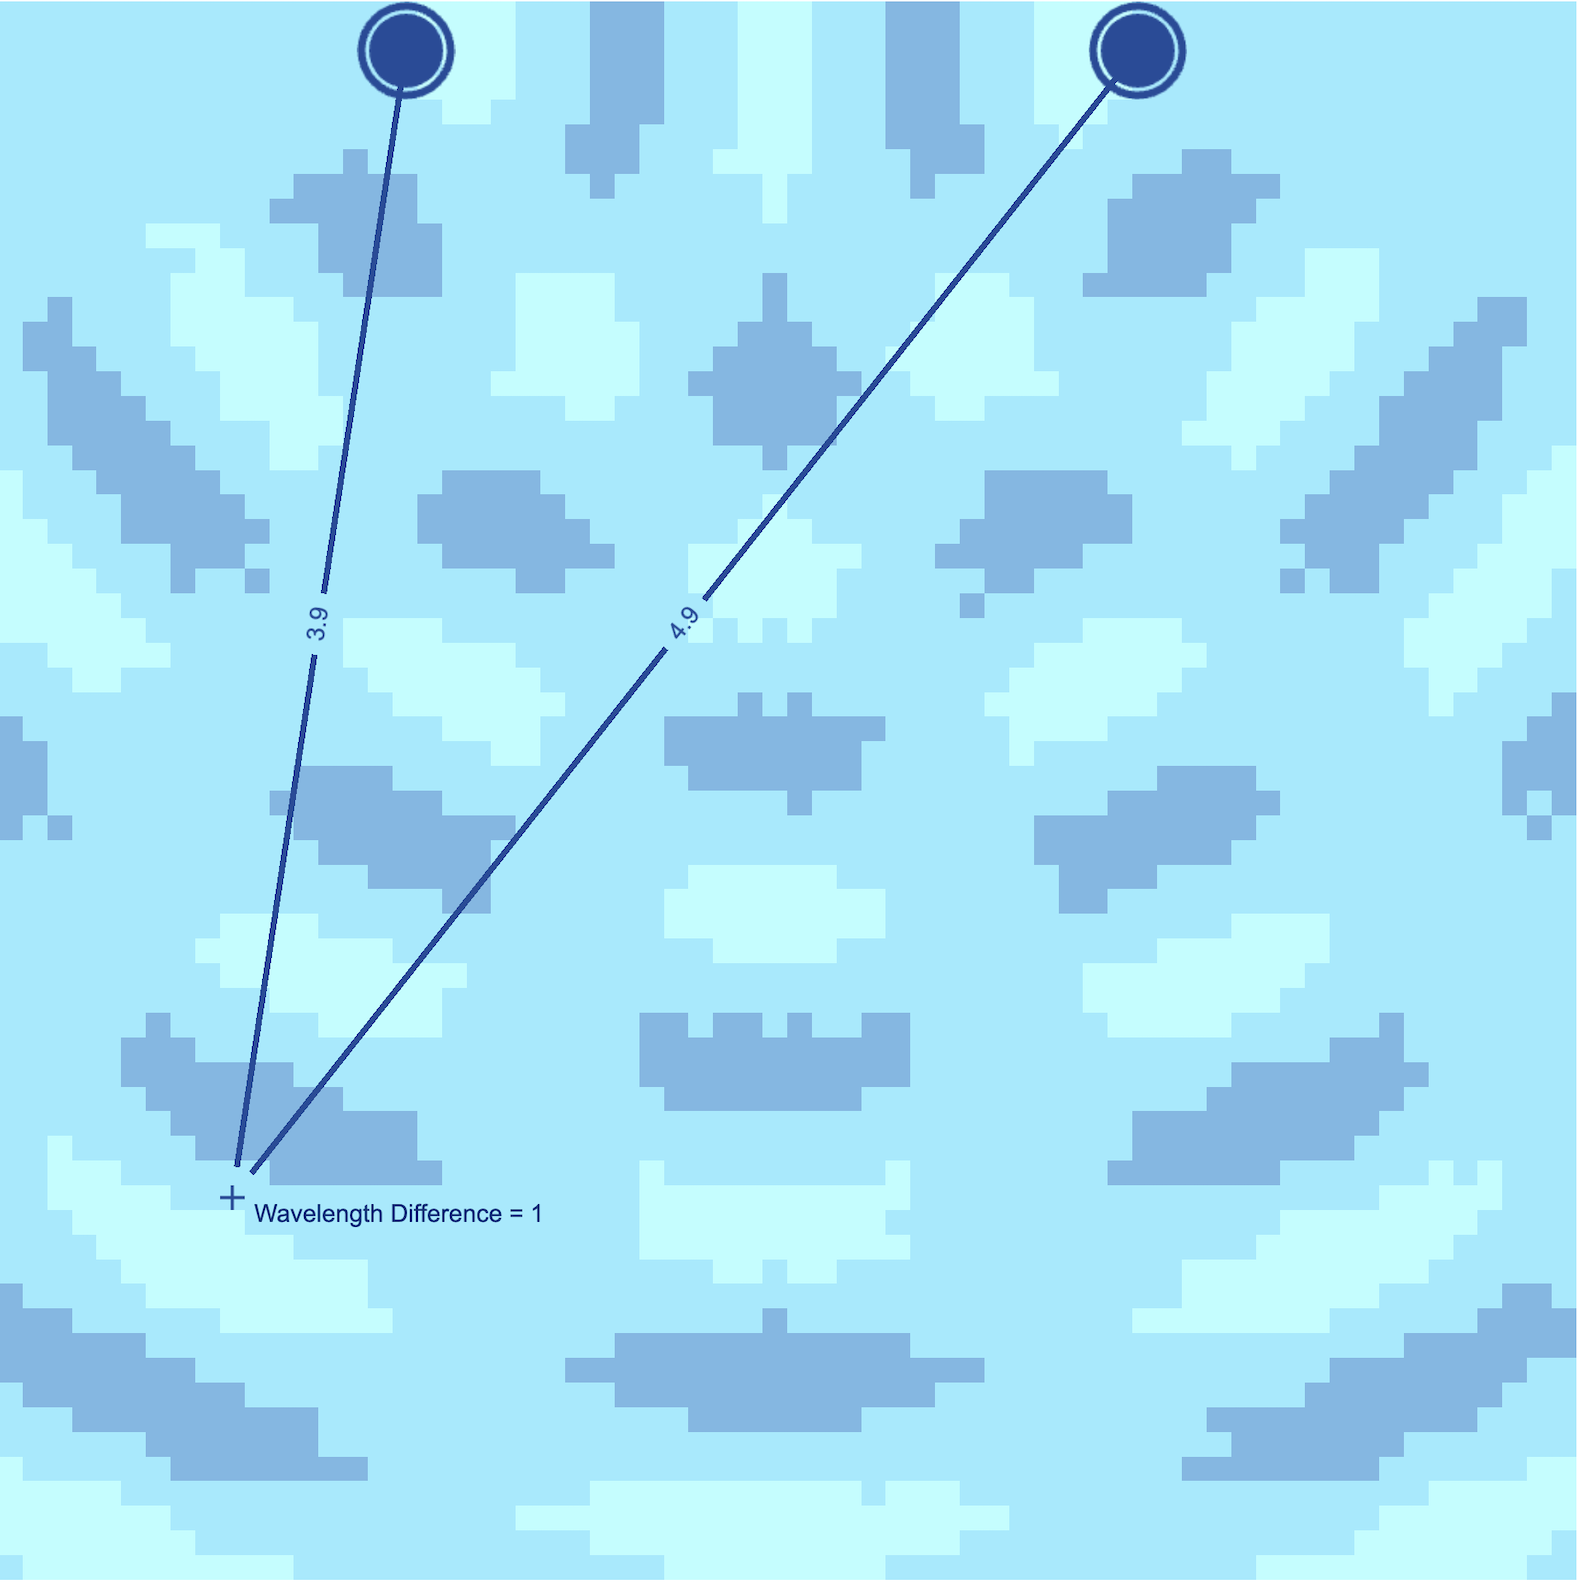
Ripple Tank Simulator
We know. That pesky ripple tank apparatus is a pain to set up. If all you wish to demonstrate is the concept of two-point source interference, here's a painless alternative - the Ripple Tank Simulator. Let the sources begin vibrating and view the pattern. Can you see the nodal and antinodal lines/ Now tap on one of the lines and let the simulator make measurements of the distance to the course and calculate the path difference (difference in the two source-to-point distances). Can you find a pattern?
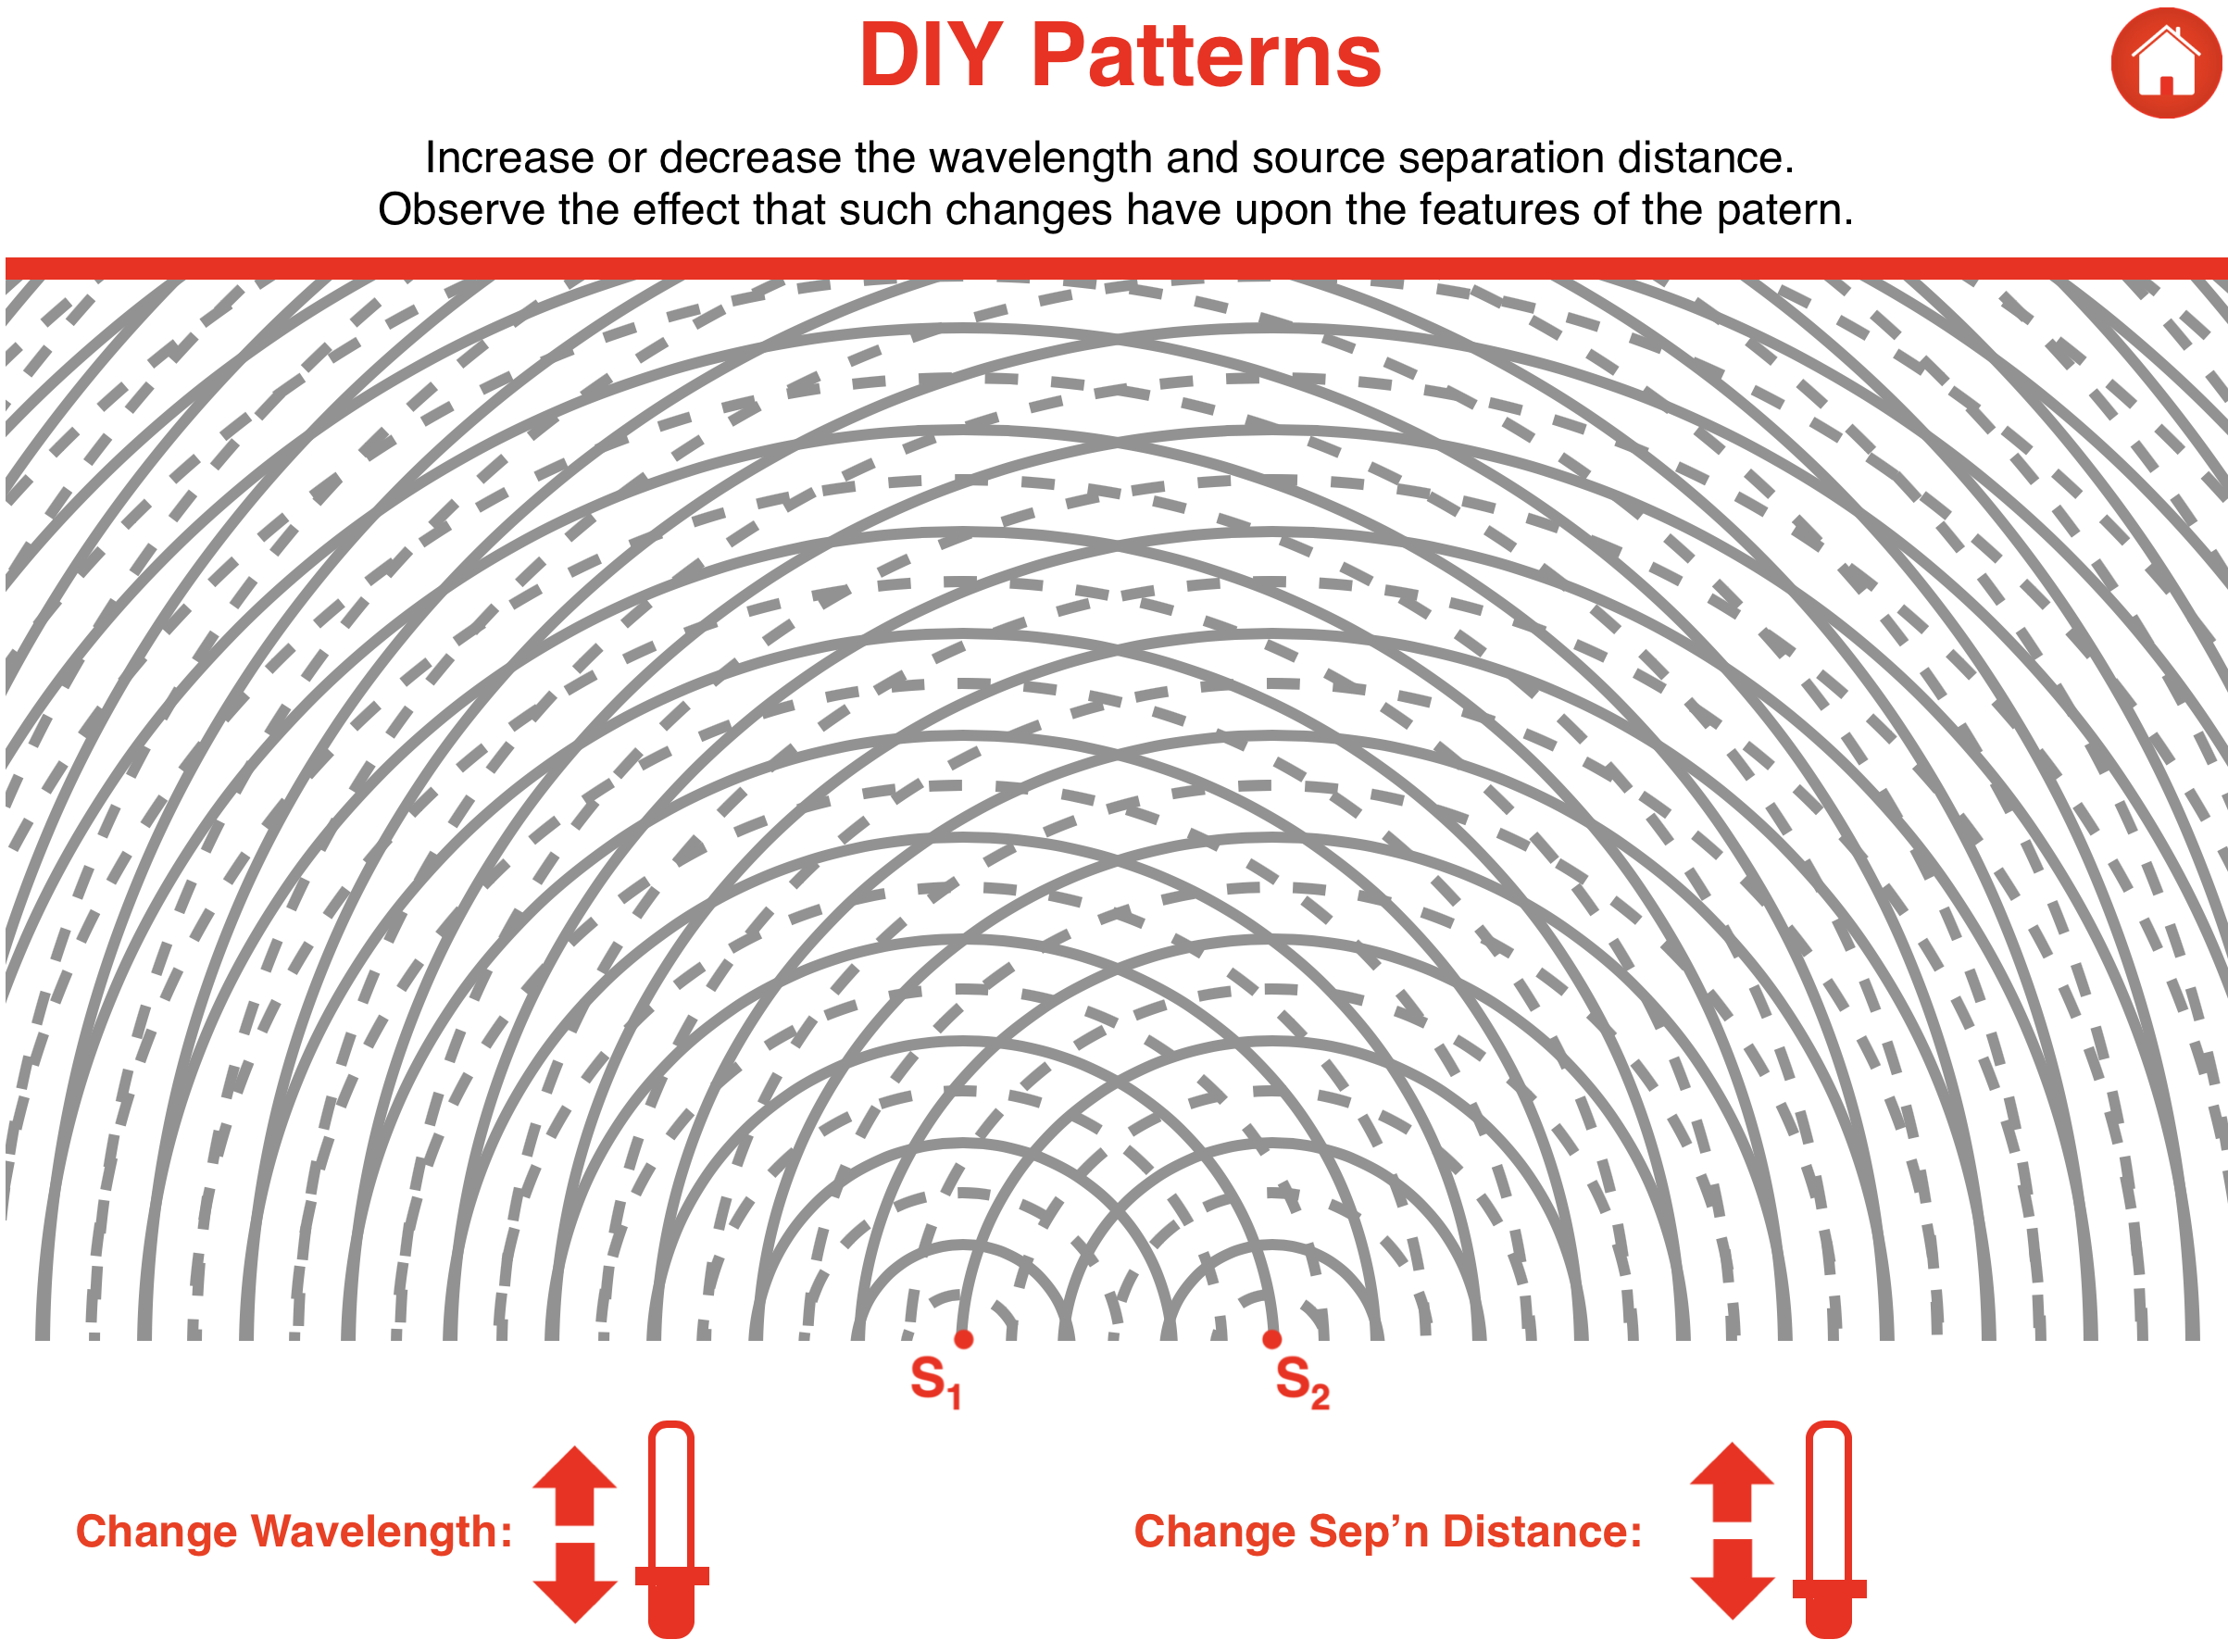
Two Point Source Interference Patterns
Grab a ripple tank and disturb the water at a periodic rate in two locations. What do you get? A two-point source interference pattern. Don't have a ripple tank? Then use ours. Explore the patterns that results when waves from two source interfere. Easily change the wavelength or the distance between sources and repeat a trial.
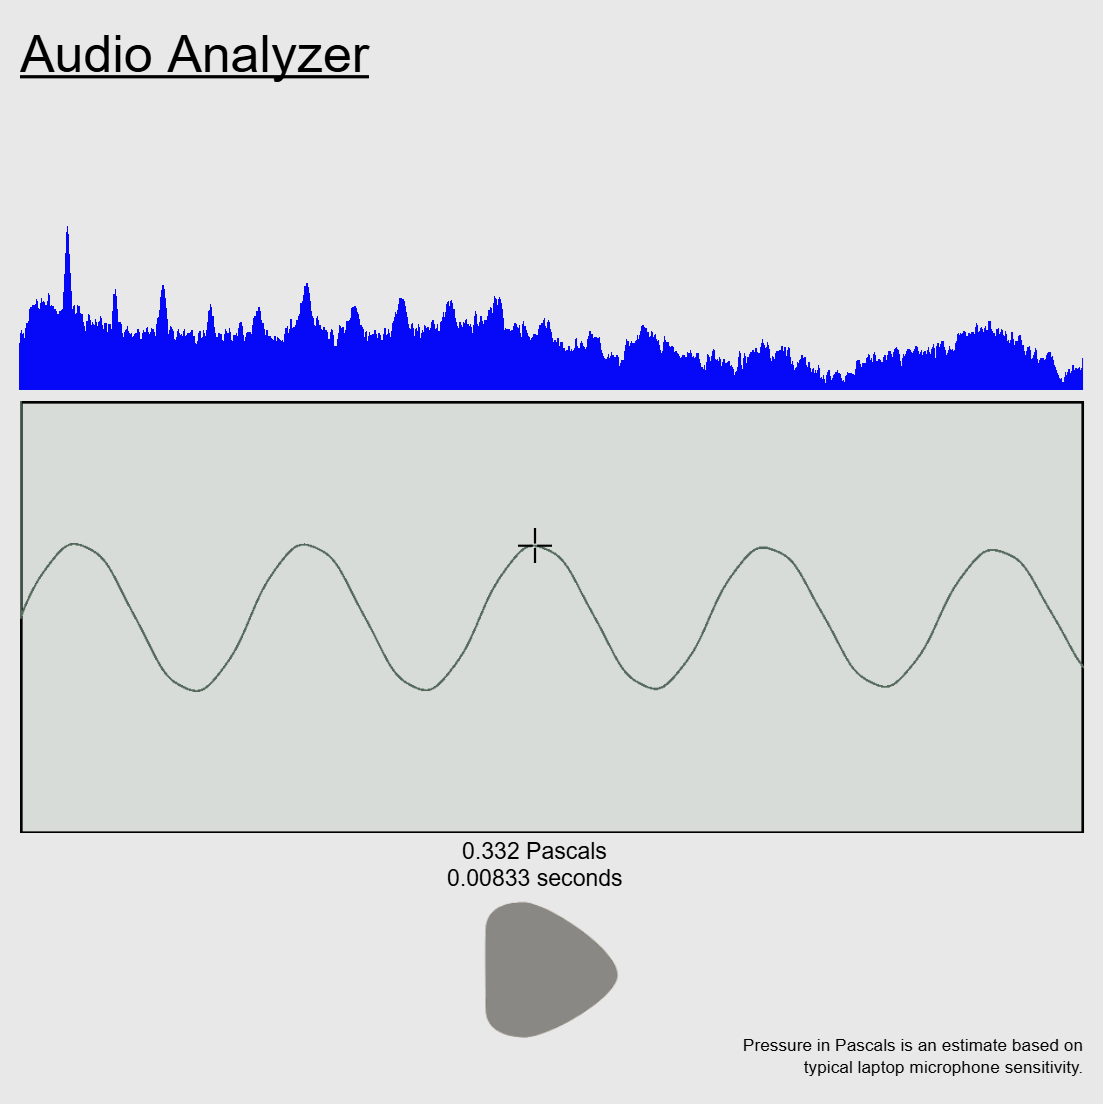
Audio Analyzer
Grab your tuning forks and get ready to dig into the Audio Analyzer. This interactive uses any microphone device on your computer, phone, or tablet to capture and display the sound produced, with an estimated pascal pressure and time readout anywhere along the sound wave.
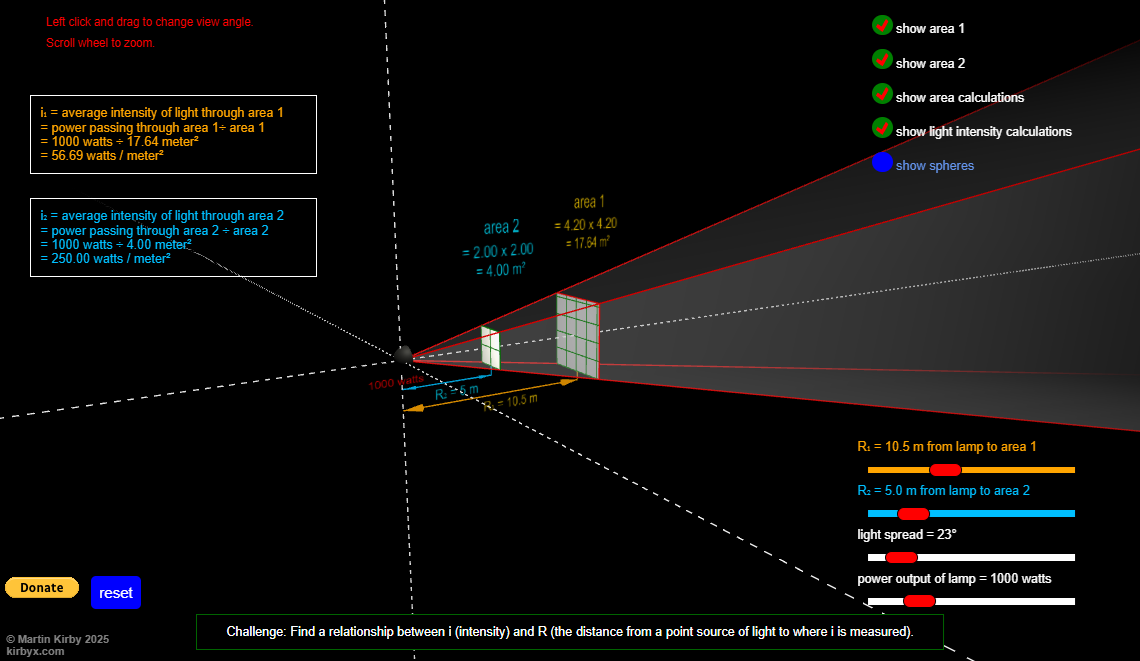
Inverse Square Law Sim
This simulation is intense! See how the Inverse Square Law helps determine the intensity of physical quantity in relationship to distance. Although this simulation uses light, the inverse square law has applications in many areas of physics, such as sound, gravity, radiation, and more!
Thanks to Physics teacher Martin Kirby for contributing this simulation to our Physics Interactives collection. You can learn more about the Inverse Square Law Sim simulation at Mr. Kirby's Google Site.
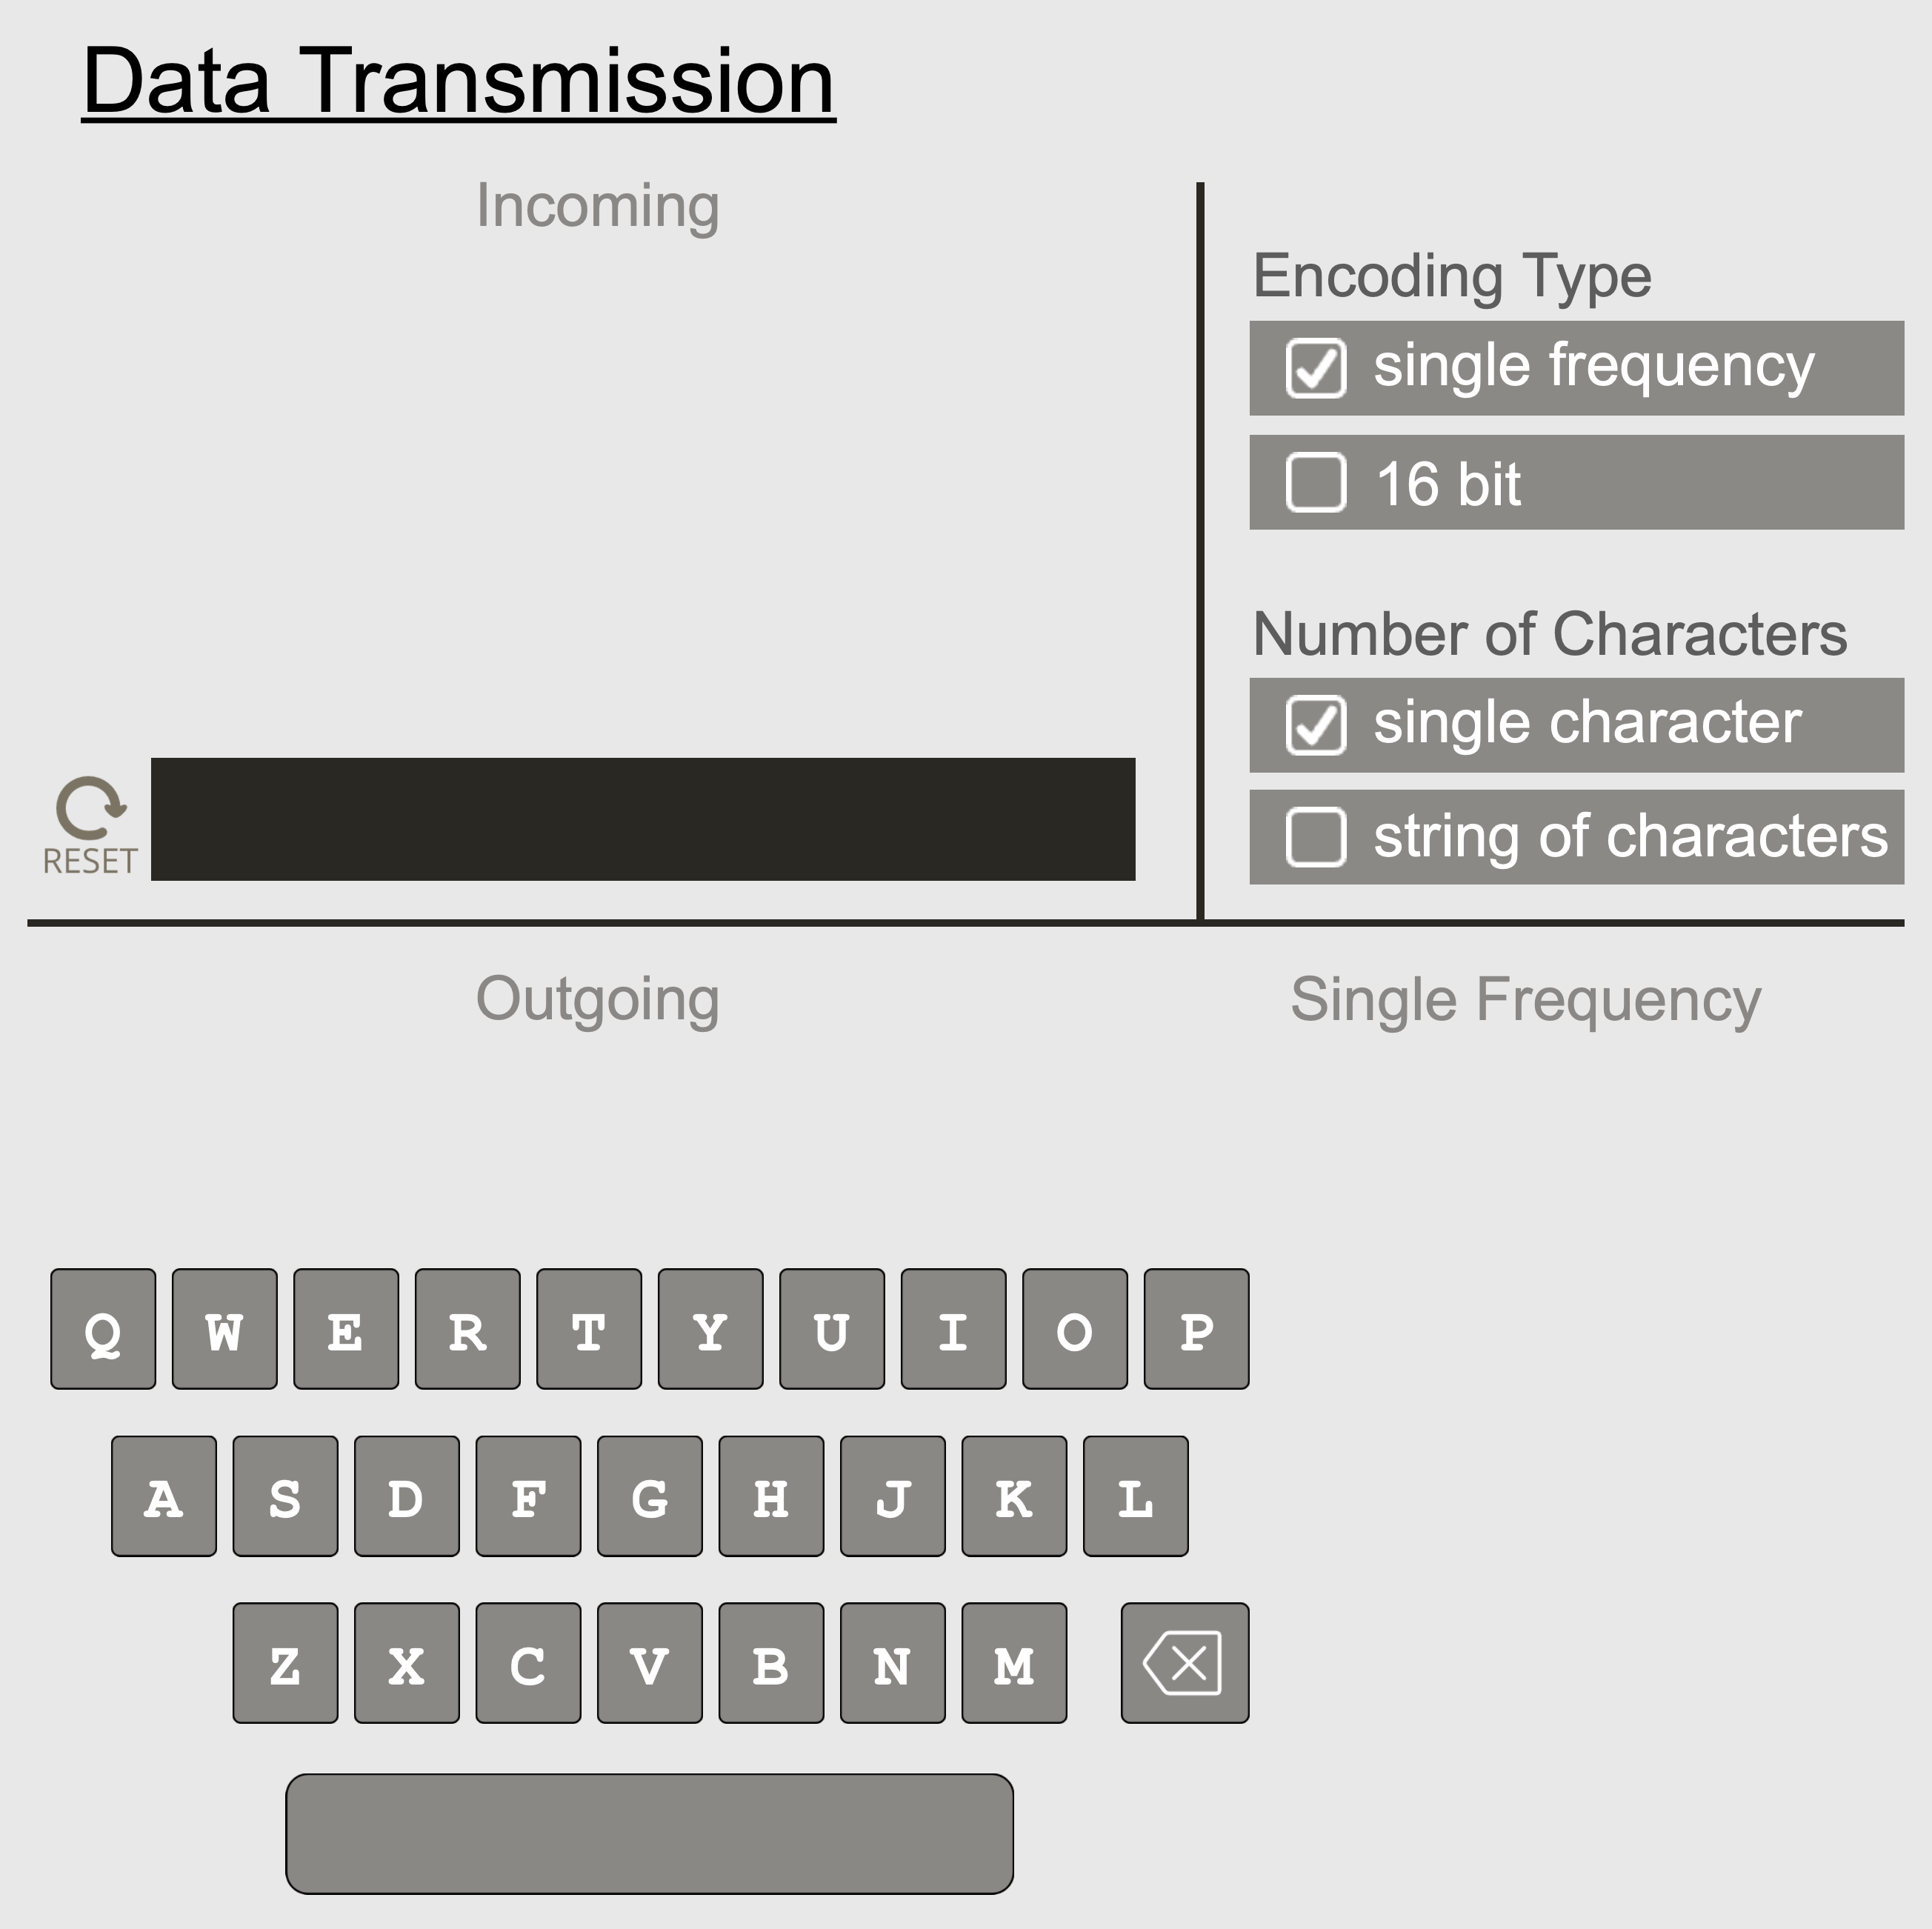
Data Transmission
How do devices use waves to transmit and receive information? Use our Data Transmission simulation to experiment with data transmission. Grab two devices, open the simulation on each decice, and start communicating with one another. Shhhh! Transmitting and receiving allowed; talking prohibited.
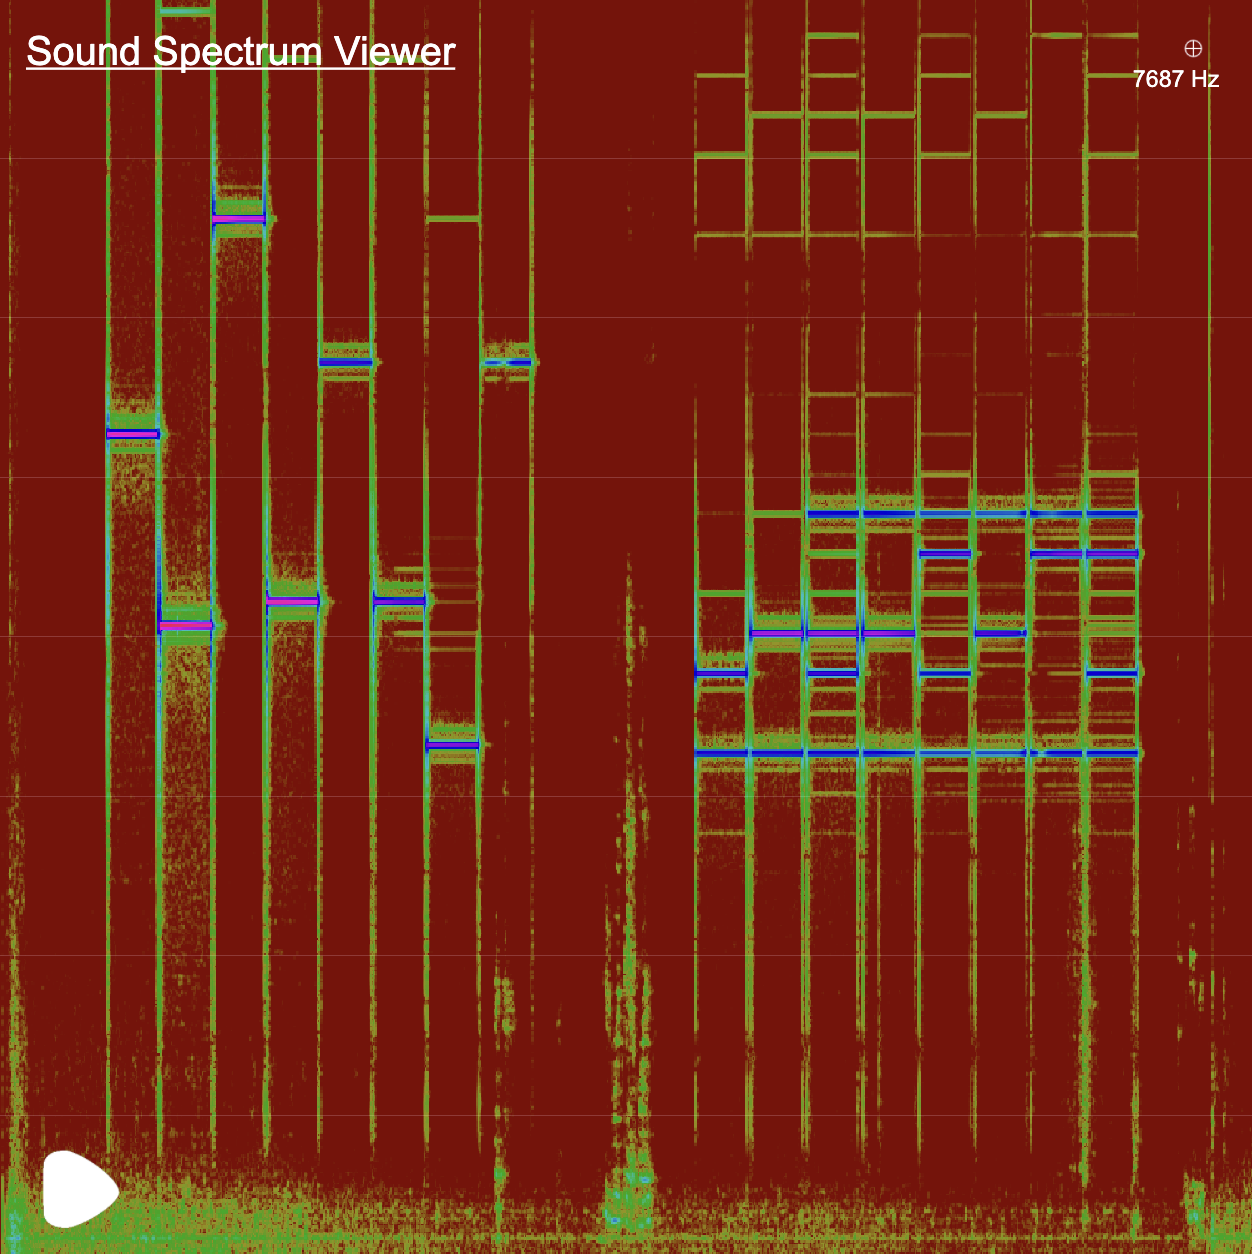
Sound Spectrum Viewer
The Sound Spectrum Viewer was created to be used as an accompaniment to our Data Transmission Interactive (above). It will capture a sound sound from any source and graphically display the sound's spectrum over the course of time. The tool will display a spectrogram and a Fast Fourier Transform (FFT) of the collected sound.