Hold down the T key for 3 seconds to activate the audio accessibility mode, at which point you can click the K key to pause and resume audio. Useful for the Check Your Understanding and See Answers.
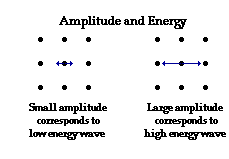
Sound waves are introduced into a medium by the vibration of an object. For example, a vibrating guitar string forces surrounding air molecules to be compressed and expanded, creating a pressure disturbance  consisting of an alternating pattern of compressions and rarefactions. The disturbance then travels from particle to particle through the medium, transporting energy as it moves. The energy that is carried by the disturbance was originally imparted to the medium by the vibrating string. The amount of energy that is transferred to the medium is dependent upon the amplitude of vibrations of the guitar string. If more energy is put into the plucking of the string (that is, more work is done to displace the string a greater amount from its rest position), then the string vibrates with a greater amplitude. The greater amplitude of vibration of the guitar string thus imparts more energy to the medium, causing air particles to be displaced a greater distance from their rest position. Subsequently, the amplitude of vibration of the particles of the medium is increased, corresponding to an increased amount of energy being carried by the particles. This relationship between energy and amplitude was discussed in more detail in a previous unit.

Sound Intensity and Distance
The amount of energy that is transported past a given area of the medium per unit of time is known as the intensity of the sound wave. The greater the amplitude of vibrations of the particles of the medium, the greater the rate at which energy is transported through it, and the more intense that the sound wave is. Intensity is the energy/time/area; and since the energy/time ratio is equivalent to the quantity power, intensity is simply the power/area.

Typical units for expressing the intensity of a sound wave are Watts/meter2.
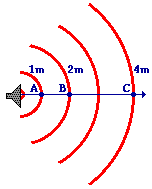
As a sound wave carries its energy through a two-dimensional or three-dimensional medium, the intensity of the sound wave decreases with increasing distance from the source.  The decrease in intensity with increasing distance is explained by the fact that the wave is spreading out over a circular (2 dimensions) or spherical (3 dimensions) surface and thus the energy of the sound wave is being distributed over a greater surface area. The diagram at the right shows that the sound wave in a 2-dimensional medium is spreading out in space over a circular pattern. Since energy is conserved and the area through which this energy is transported is increasing, the intensity (being a quantity that is measured on a per area basis) must decrease.
The mathematical relationship between intensity and distance is sometimes referred to as an inverse square relationship. The intensity varies inversely with the square of the distance from the source. So if the distance from the source is doubled (increased by a factor of 2), then the intensity is quartered (decreased by a factor of 4). Similarly, if the distance from the source is quadrupled, then the intensity is decreased by a factor of 16. Applied to the diagram at the right, the intensity at point B is one-fourth the intensity as point A and the intensity at point C is one-sixteenth the intensity at point A. Since the intensity-distance relationship is an inverse relationship, an increase in one quantity corresponds to a decrease in the other quantity. And since the intensity-distance relationship is an inverse square relationship, whatever factor by which the distance is increased, the intensity is decreased by a factor equal to the square of the distance change factor. The sample data in the table below illustrate the inverse square relationship between power and distance.
|
Distance
|
Intensity
|
|
1 m
|
160 units
|
|
2 m
|
40 units
|
|
3 m
|
17.8 units
|
|
4 m
|
10 units
|
The Threshold of Hearing and the Decibel Scale
Humans are equipped with very sensitive ears capable of detecting sound waves of extremely low intensity. The faintest sound that the typical human ear can detect has an intensity of 1*10-12 W/m2. This intensity corresponds to a pressure wave in which a compression of the particles of the medium increases the air pressure in that compressional region by a mere 0.3 billionth of an atmosphere. A sound with an intensity of 1*10-12 W/m2 corresponds to a sound that will displace particles of air by a mere one-billionth of a centimeter. The human ear can detect such a sound. WOW! This faintest sound that a human ear can detect is known as the threshold of hearing (TOH). The most intense sound that the ear can safely detect without suffering any physical damage is more than one billion times more intense than the threshold of hearing.
Since the range of intensities that the human ear can detect is so large, the scale that is frequently used by physicists to measure intensity is a scale based on powers of 10. This type of scale is sometimes referred to as a logarithmic scale. The scale for measuring intensity is the decibel scale. The threshold of hearing is assigned a sound level of 0 decibels (abbreviated 0 dB); this sound corresponds to an intensity of 1*10-12 W/m2. A sound that is 10 times more intense ( 1*10-11 W/m2) is assigned a sound level of 10 dB. A sound that is 10*10 or 100 times more intense (1*10-10 W/m2) is assigned a sound level of 20 db. A sound that is 10*10*10 or 1000 times more intense (1*10-9 W/m2) is assigned a sound level of 30 db. A sound that is 10*10*10*10 or 10000 times more intense (1*10-8 W/m2) is assigned a sound level of 40 db. Observe that this scale is based on powers of 10. If one sound is 10x times more intense than another sound, then it has a sound level that is 10*x more decibels than the less intense sound. The table below lists some common sounds with an estimate of their intensity and decibel level.
|
Source
|
Intensity
|
Intensity Level
|
# of Times
Greater Than TOH
|
|
Threshold of Hearing (TOH)
|
1*10-12 W/m2
|
0 dB
|
100
|
|
Rustling Leaves
|
1*10-11 W/m2
|
10 dB
|
101
|
|
Whisper
|
1*10-10 W/m2
|
20 dB
|
102
|
|
Normal Conversation
|
1*10-6 W/m2
|
60 dB
|
106
|
|
Busy Street Traffic
|
1*10-5 W/m2
|
70 dB
|
107
|
|
Vacuum Cleaner
|
1*10-4 W/m2
|
80 dB
|
108
|
|
Large Orchestra
|
6.3*10-3 W/m2
|
98 dB
|
109.8
|
|
Walkman at Maximum Level
|
1*10-2 W/m2
|
100 dB
|
1010
|
|
Front Rows of Rock Concert
|
1*10-1 W/m2
|
110 dB
|
1011
|
|
Threshold of Pain
|
1*101 W/m2
|
130 dB
|
1013
|
|
Military Jet Takeoff
|
1*102 W/m2
|
140 dB
|
1014
|
|
Instant Perforation of Eardrum
|
1*104 W/m2
|
160 dB
|
1016
|
Investigate!
Knowing the intensity of a sound wave allows one to calculate the deciBel (dB) level of that sound. Use the DeciBel Calculator widget to determine the deciBel rating from any intensity in Watt/meter2. Enter intensities using scientific notation - for example, enter 5e-5 for 5.0x10⁻⁵.
Do you want to learn how to do the mathematics yourself? Maybe it's a course objective and just having the answer given to you by an online widget isn't going to get you through the test. Take some time to learn how to calculate the intensity from the deciBel rating and the deciBel rating from the intensity:
Loudness and Intensity
While the intensity of a sound is a very objective quantity that can be measured with sensitive instrumentation, the loudness of a sound is more of a subjective response that will vary with a number of factors. The same sound will not be perceived to have the same loudness to all individuals. Age is one factor that affects the human ear's response to a sound. Quite obviously, your grandparents do not hear like they used to. The same intensity sound would not be perceived to have the same loudness to them as it would to you. Furthermore, two sounds with the same intensity but different frequencies will not be perceived to have the same loudness. Because of the human ear's tendency to amplify sounds having frequencies in the range from 1000 Hz to 5000 Hz, sounds with these intensities seem louder to the human ear. Despite the distinction between intensity and loudness, it is safe to state that the more intense sounds will be perceived to be the loudest sounds.
Investigate!
As mentioned in the previous paragraph, even the frequency will affect our perception of the loudness of a sound. For instance, a 100 Hz sound at 60 dB will not sound as loud as a 1000 Hz sound at 60 deciBel. Fletcher–Munson curves or equal loudness curves are often used to demonstrate the perceived loudness of a sound for a given frequency. Use the widget to investigate the effect of the frequency upon the perceived loudness and to view the equal loudness curves.
Check Your Understanding
1. A mosquito's buzz is often rated with a decibel rating of 40 dB. Normal conversation is often rated at 60 dB. How many times more intense is normal conversation compared to a mosquito's buzz?
|
a. 2
|
b. 20
|
c. 100
|
d. 200
|
e. 400
|
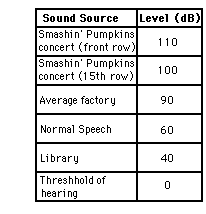
 2. The table at the right represents the decibel level for several sound sources. Use the table to make comparisons of the intensities of the following sounds.
How many times more intense is the front row of a Smashin' Pumpkins concert than ...
a. ... the 15th row of the same concert?
b. ... the average factory?
c. ... normal speech?
d. ... the library after school?
e. ... the sound that most humans can just barely hear?
3. On a good night, the front row of the Twisted Sister concert would surely result in a 120 dB sound level. An IPod produces 100 dB. How many IPods would be needed to produce the same intensity as the front row of the Twisted Sister concert?