Hold down the T key for 3 seconds to activate the audio accessibility mode, at which point you can click the K key to pause and resume audio. Useful for the Check Your Understanding and See Answers.
 One tool which can be utilized to express an understanding of the work-energy theorem is a bar chart. A work-energy bar chart represents the amount of energy possessed by an object by means of a vertical bar. The length of the bar is representative of the amount of energy present, with a longer bar representing a greater amount of energy. In a work-energy bar chart, a bar is constructed for each form of energy. Consistent with the work-energy relationship discussed in this lesson, the sum of all forms of initial energy plus the work done on the object by external forces equals the sum of all forms of final energy.
KEi + PEi + Wext = KEf + PEf
In a work-energy bar chart, a bar is used to represent the amount of each term in the above equation. Consequently, the sum of the bar heights for the initial condition (initial energy + external work) must equal the sum of the bar heights for the final condition (final energy). Since the potential energy comes in two forms - the elastic potential energy stored in springs (PEspring) and the gravitational potential energy (PEgrav) - the above equation is rewritten as
KEi + PEi-grav + PEi-spring + Wext = KEf + PEf-grav + PEf-spring
In this portion of Lesson 2, we will investigate the use and meaning of work-energy bar charts and make an effort to apply this understanding to a variety of motions involving energy changes or energy transformations.
Procedure for Constructing Bar Charts
The following procedure might be useful for constructing work-energy bar charts:
- analyze the initial and final states of the object in order to make decisions about the presence or absence of the different forms of energy
- analyze the forces acting upon the object during the motion to determine if external forces are doing work and whether the work (if present) is positive or negative
- construct bars on the chart to illustrate the presence and absence of the various forms of energy for the initial and final state of the object; the exact height of the individual bars is not important; what is important is that the sum of the heights on the left of the chart is balanced by the sum of the heights on the right of the chart
The above procedure is illustrated below.
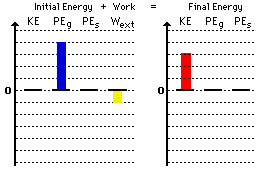
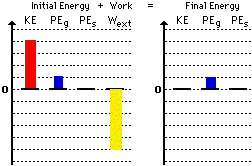
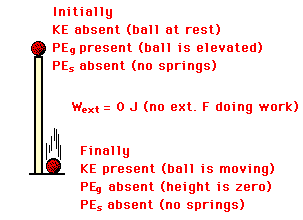 Consider a ball falling from the top of a pillar to the ground below; ignore air resistance. The initial state is the ball at rest on top of the pillar and the final state is the ball just prior to striking the ground. Given this motion and the identification of the initial and final state of the ball, decisions can be made about the presence and absence of each form of energy. Since there is no motion at the top of the pillar, there is no initial kinetic energy. Since the ball is elevated above the ground while on top of the pillar, there is an initial gravitational potential energy (PEgrav). There are no springs involved; thus, there is neither initial nor final elastic potential energy (PEspring). In the final condition (just prior to striking the ground), the ball is moving. Thus, there is a final kinetic energy. And finally, the ball is no longer elevated above the ground so there is no final gravitational potential energy. The ball falls under the influence of gravity (an internal force) alone. Thus there are no external forces present nor doing work. The diagram at the right summarizes this analysis.
To complete the bar chart, an arbitrarily decided height for each bar is decided upon and a bar is constructed for each form of energy. As mentioned before, it is not important exactly how high each bar is. It is only important that the sum of the bar heights on the left balance the sum of the bar heights on the right.
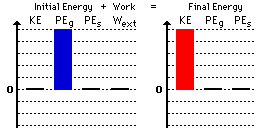
Observe that this work-energy bar chart reveals that
- there is no kinetic and elastic potential energy in the initial state
- there is no gravitational and elastic potential energy in the final state
- there is no work done by external forces
- the sum of the heights on the right (5 units) equals the sum of the heights on the left (5 units)
It is not important as to how high the two bars are in the above bar chart. If the bars were 4 units high instead of 5 units high, then it would be an equally acceptable bar chart. The decision about bar height is entirely arbitrary.
|
Perhaps at this time you may want to review the lessons on work, potential energy and kinetic energy. Use the links below.
|
The Example of a Skidding Car
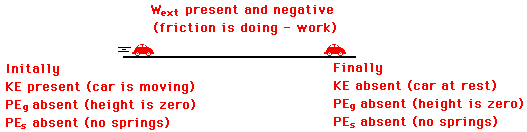
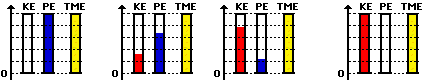
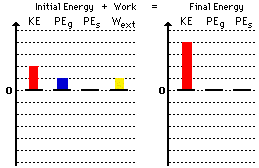
Now we will repeat the process for a car which skids from a high speed to a stop across level ground with its brakes applied. The initial state is the car traveling at a high speed and the final state is the car at rest. Initially, the car has kinetic energy (since it is moving) but does not have gravitational potential energy (since the height is zero) or elastic potential energy (since there are no springs). In the final state of the car, there is neither kinetic energy (since the car is at rest) nor potential energy (since there is no height nor springs). The force of friction between the tires of the skidding car and the road does work on the car. Friction is an external force. Friction does negative work since its direction is opposite the direction of the car's motion.
Now that the analysis is complete, the bar chart can be constructed. The chart must be consistent with the above analysis.
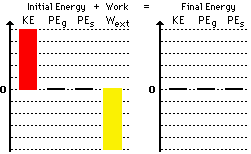
Observe that the bar for work is a downward bar. This is consistent with the fact that the work done by friction is negative work. Whenever negative work is done by external forces, the Wext bar will be a downward bar. Note also that the sum of the bar height on the left side (+5 plus -5) is the same as the sum of the bar heights on the right side of the chart. One final comment is in order: even though the height of all bars on the left equals the height of all bars on the right, energy is not conserved. The bar chart includes both energy and work on the left side of the chart. If work is done by external forces, then the only reason that the sum of the bar heights are equal on both sides is that the Wext makes up for the difference between the initial and final amounts of total mechanical energy.

|
Perhaps at this time you may want to review the lessons on work, potential energy and kinetic energy. Use the links below.
|
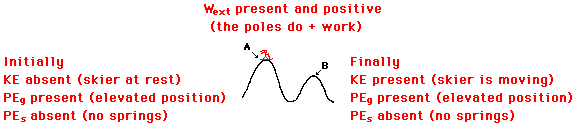
The Example of a Skier
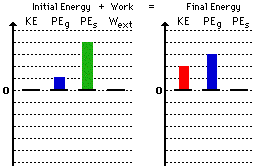
As a final example consider a skier that starts from rest on top of hill A and skis into the valley and back up onto hill B. The skier utilizes her poles to propel herself across the snow, thus doing work to change her total mechanical energy. The initial state is on top of hill A and the final state is on top of hill B. Suppose that friction and air resistance have a negligible effect on the motion. In the initial state, the skier has no kinetic energy (the skier is said to be at rest). There is no elastic potential energy in both the initial and the final states (since there are no springs). The skier has gravitational potential energy in both the initial and the final states (since the skier is at an elevated position). Finally, work is being done by external forces since the skier is said to be using "her poles to propel herself across the snow." This work is positive work since the force of the snow on her poles is in the same direction as her displacement.
Now that the analysis is complete, the bar charts can be constructed. The charts must be consistent with the above analysis.
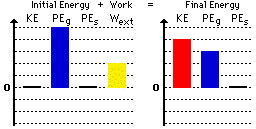
Observe that the bar for work is an upward bar. This is consistent with the fact that the work done by the poles is positive work. Whenever positive work is done by external forces, the Wext bar will be an upward bar. Note also that the sum of the bar height on the left side (+5 plus +2) is the same as the sum of the bar heights on the right side (+4 plus +3) of the chart. As mentioned earlier, the exact heights of the individual bars are not important. It is only important that the bars exist, that they are in the correct direction (upward) and that their sum on the left is the same as the sum on the right.
|
Perhaps at this time you may want to review the lessons on work, potential energy and kinetic energy. Use the links below.
|
A Different Type of Bar Chart
On occasions it is customary to utilize a different type of work-energy bar chart that looks like the diagram below. If external forces are not doing work, then the total mechanical energy is conserved. The Wext term cancels from the work-energy equation leaving the equation
KEi + PEi = KEf + PEf
This equation shows that the total mechanical energy (potential energy plus kinetic energy) is the same in the initial state as it is in the final state. In fact, if external forces are not doing work, then the total mechanical energy will be the same throughout the entire motion. For such situations it is customary to use the different style of bar chart to depict energy conservation. A series of bars are shown for a variety of positions throughout the motion; each set of bars reveals that the total mechanical energy (TME) is always the same while the potential energy (PE) and the kinetic energy (KE) are constantly changing.
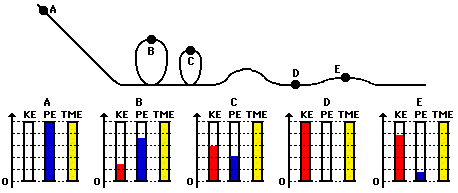
As an example of the use of this bar chart, consider a roller coaster car in the ideal situation in which the force of air resistance is assumed negligible (indeed, an idealized situation). Since the normal force acts at right angles to the motion at all times, it does not do work. The only force doing work on the roller coaster car is gravity. And since the force of gravity is an internal or conservative force, the total mechanical energy is conserved (i.e., not changing). The energy may change forms - transforming from potential to kinetic and vice versa. Yet the total amount will never change. The diagram below depicts the conservation of total mechanical energy and the transformation of potential and kinetic energy for a roller coaster car at five positions along a track.
In conclusion, bar charts are a useful tool for depicting the influence of external forces (if present) upon the total mechanical energy. It is a conceptual tool for representing one's understanding of the work-energy relationship.
We Would Like to Suggest ...

Sometimes it isn't enough to just read about it. You have to interact with it! And that's exactly what you do when you use one of The Physics Classroom's Interactives. We would like to suggest that you combine the reading of this page with the use of our
Roller Coaster Model Interactive, our
Mass on a Spring Interactive, and/or our
Chart That Motion Interactive. These three Interactives can be found in the Physics Interactive section of our website and provide an interactive opportunity to explore the work-energy relationship.
Check Your Understanding
Construct analyses and work-energy bar charts for the following motions. Then check the answers by clicking the button and by clicking on the See Bar Chart link.
1. A ball is dropped from rest from a bridge. As the ball falls through the air, it encounters a small amount of air resistance. The final state of the ball is the instant before it strikes the water.
See Bar Chart
2. A volleyball player spikes the ball at just above net level and drives it over the net. The initial state is the ball just prior to the spike. The final state of the ball is the instant before it strikes the ground.
See Bar Chart
3. A spring gun is used to project a sponge dart into the air at an angle to the horizontal. The gun is held at a height of 1-meter before the trigger is pulled. The loaded spring gun is the initial state and the sponge dart at its peak is the final state.
See Bar Chart
4. A baseball is caught by a catcher after passing over home plate. The initial state is the baseball moving at high speed just prior to hitting the catcher's mitt. The final state is the baseball just after the catcher has applied the force to stop the ball. Assume that the ball does not change height as the catcher is catching it.
See Bar Chart
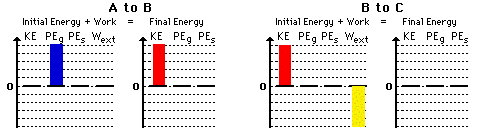
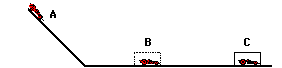 5. In a physics lab, a Hot Wheels car starts at an elevated position, moves down an incline to the level ground, strikes a box and skids to a stop. Consider three states for the car: state A is the top of the incline; state B is the bottom of the incline before striking the box; state C is after the car has been brought to a stop. Use the diagram at the right and your understanding of the work-energy theorem to construct bar charts for the motion from A to B and from B to C.
See Bar Charts
Answers to Above Questions
1. Here is the bar chart for question #1 above.
Return to Question 1.
2. Here is the bar chart for question #2 above.
Return to Question 2.
3. Here is the bar chart for question #3 above.
Return to Question 3.
4. Here is the bar chart for question #4 above.
Return to Question 4.
5. Here is the bar chart for question #5 above.
Return to Question 5.