 Heating Curve
Resource:
The Science Reasoning Center: Heating Curve
Grade Level: High School
Description:
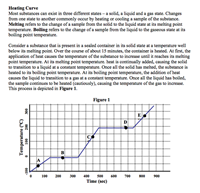
This passage describes the phase changes that occur in a sample of matter as it is heated from a temperature below its melting point to a temperature above its boiling point. In addition to the two paragraphs describing the state changes, a heating curve graph is included. Questions target a student's ability to use the model presented in the body of text to interpret the graph, to connect information in the body of text to the graph, and to compare various points on the graph to one another in terms of the state of matter that is present and the process (state change or temperature increase) that is occurring.
Performance Expectation:
HS-PS3-2 Develop and use models to illustrate that energy at the macroscopic scale can be accounted for as a combination of energy associated with the motions of particles (objects) and energy associated with the relative positions of particles (objects).
In this passage students use a graphical model (heating curve) to understand that when heat is added to a substance the added energy either raises the temperature of the substance, changes the state of that substance, or both. As students try to understand
why this uniquely shaped graph makes sense, they are drawn to consider matter at the molecular level. While macroscopic changes (in temperature or state of matter) can be observed, students can understand why these changes take place in terms of energy associated with the motion of the molecules that make up that substance.
This activity aligns with the three dimensions of the Next Generation Science Standards in the manner described below:
| Definitions of Energy (HS-PS3.A.3): These relationships are better understood at the microscopic scale, at which all of the different manifestations of energy can be modeled as a combination of energy associated with the motion of particles and energy associated with the configuration (relative position of the particles). |
Heating a substance will result in a temperature change of that substance, changing the substance’s state of matter, or both. The disciplinary core idea addressed in this passage is best understood by considering that all substances are a collection of particles (molecules) that are in random motion. This idea is called the ‘kinetic molecular theory.’ As energy is added to a substance, that energy increases the kinetic energy of these particles (temperature change) or goes into breaking existing bonds between these particles (change of state). |
| Energy and Matter: Changes of energy and matter in a system can be described in terms of energy and matter flows into, out of, and within that system. |
This passage explores the results of adding energy to a substance. Through text descriptions and a graph showing the substance’s heating curve, the reader encounters the fact that adding energy must change the system in some manner. This passage outlines that this addition of energy to the system changes the temperature of substance, its state of the matter, or both. |
| Analyzing and Interpreting Data: Analyze data using tools, technologies, and/or models (e.g., computational, mathematical) in order to make valid and reliable scientific claims or determine an optimal design solution. |
Much of the text description and the questions at the end of the passage point the reader to a graphical representation showing a substance’s temperature as heat is added. This graph is known as a ‘heating curve.’ Analysis of this graph leads students to understand that the addition of energy may result in a temperature change but that it may also result in changing the state of matter by breaking bonds at the molecular level. Students consider several questions that the end of the passage in which they interpret this graph and what is suggests about the state of matter at various locations on the graph itself. |
| Developing and Using Models: Develop and/or use a model to generate data to support explanations, analyze systems, or solve problems. |
The heating curve is an important graphical representation of a substance’s temperature as heat is added. In this passage, students will use this graphical model as they support explanations and analyze the effects of adding energy to a substance. In the end, as students work to understand why the graph has its unique shape, students begin to see why the kinetic molecular theory is also a reasonable model. |
Associated Reading from The Physics Classroom
View Infographic.
(Coming Soon)
Search the NGSS Corner
Maybe you're looking for something really specific that pertains to a desired topic and emphasizes one or more of the listed NGSS dimensions. Why not try a search of this section of our website? Simply select from one or more of the pull-down menus and click Search This page will reload and a collection of possibilities will be displayed in this section of the page and sorted by relevancy.