Hold down the T key for 3 seconds to activate the audio accessibility mode, at which point you can click the K key to pause and resume audio. Useful for the Check Your Understanding and See Answers.
Previously in Lesson 3 we have seen how circular waves from two sources can interfere in the surrounding space to produce a pattern of antinodes and nodes. The nodal positions are present at locations where destructive interference always occurs and the path difference is a half-number of wavelengths. The antinodal positions are present at locations where constructive interference always occurs and the path difference is equivalent to a whole number of wavelengths.
|
Antinodal Points:
|
PD = m • λ
|
where m = 0, 1, 2, 3, 4, ...
|
| |
|
|
|
Nodal Points:
|
PD = m • λ
|
where m = 0.5, 1.5, 2.5, 3.5, ...
|
The discussion of the interference patterns was introduced by referring to the interference of water waves in a ripple tank. All waves behave the same, whether they are water waves created by vibrating sources in a ripple tank, sound waves produced by two speakers, or light waves produced by two light sources. For water waves in a ripple tank, the resulting pattern would include locations along the water's surface where water was vibrating up and down with unusually large amplitudes (antinodes). And there would be other locations where the water was relatively undisturbed (nodes). For sound waves produced by two speakers, the interference pattern would be characterized by locations where the sound intensity was large due to constructive interference (antinodes). And there would be other locations where sound cancellation occurs and the sound intensity was relatively faint or not even heard at all (nodes). But what would be observed in a two-point source light interference pattern?
A Light Interference Pattern
As in any two-point source interference pattern, light waves from two coherent, monochromatic sources (more on coherent and monochromatic later) will interfere constructively and destructively to produce a pattern of antinodes and nodes. Light traveling through the air is typically not seen since there is nothing of substantial size in the air to reflect the light to our eyes. Thus, the pattern formed by light interference cannot be seen unless it is somehow projected onto some form of a screen or a sheet of paper. When light from the two sources is projected onto a screen, the pattern becomes quite evident. Locations where light constructively interferes corresponds to an abnormally bright spot. Locations where light destructively interferes corresponds to an abnormally dark spot. That is, the antinodes are locations where light from the two individual sources are reinforcing each other and correspond to points of brightness or maximum intensity (sometimes referred to as maxima). And the nodes are locations where light from the two individual sources are destroying each other and correspond to points of darkness or minimum intensity (sometimes referred to as minima).
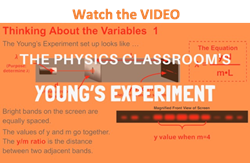
Red laser light passing through two narrowly spaced slits is typically used in the classroom to produce this effect. Thus, a pattern of bright red and dark fringes or bands is observed on a screen as shown in the diagram below.
In the above pattern, the central bright band where light displays maximum intensity corresponds to a point on the central antinodal line. The bright bands to the right and the left of the central bright band correspond to the projection of other antinodal lines onto the screen. The dark bands correspond to the projection of the nodal lines onto the screen.
As mentioned earlier in Lesson 3, each antinodal and nodal line is assigned a number or order value (m). The red band of maximum brightness located in the center of screen (the central maximum) is assigned an order number of m = 0. The other bright red bands to the left and the right of the central maximum are assigned whole number values of 1, 2, 3, ... as shown in the diagram below. The dark bands on the pattern are assigned half number values of 0.5, 1.5, 2.5, ... as shown in the diagram below.
The goal of such a classroom demonstration is typically twofold: 1) to demonstrate the wavelike nature of light by displaying its ability to interfere; and 2) to use the interference pattern to measure the wavelength of light and verify the mathematical model of two-point source interference.
Derivation of Young's Equation
In 1801, this experiment was performed for the first time by Thomas Young. Young expanded the mathematical model presented above by relating the wavelength of light to observable and measurable distances. Today, an experimental setup similar to that of Thomas Young's is commonly used in a Physics classroom to repeat the experiment and to measure the wavelength of light. In the experiment as it is commonly performed today, light from a laser beam is passed through two narrowly spaced slits in a slide or sheet of paper. The light diffracts through the slits and interferes in the space beyond the slits. Thus, the slits serve as the two sources. The interference pattern is then projected onto a screen, paper or a whiteboard located several meters away. The spatial separation of nodes and antinodes on the screen is clearly seen.
The most reliably measured distances in this experimental procedure are the distance from the sources to the screen, the distance between the sources, and the distance between the bright spots that appear on the screen. Thus, Thomas Young derived an equation that related the wavelength of the light to these measurable distances. The derivation, which involves relatively simple geometry, right-angle trigonometry and algebra, is repeated below.
The diagram below on the left depicts two sources labeled S1 and S2 and separated by some distance d. Point P is a point on the screen that happens to be located on some nodal or antinodal line; as such, there is an order value (m) associated with this point. Point C is the central point on the screen. The distance from point P to point C as measured perpendicular to the central antinodal line will be referred to as y. The screen is located a distance of L from the sources. In the following derivation, the wavelength of light will be related to the quantities d, m, y and L.
On the diagram above, source S2 is further from point P than source S1 is. The extra distance traveled by waves from S2 can be determined if a line is drawn from S1 perpendicular to the line segment S2P. This line is drawn in the diagram on the left above; it intersects line segment S2P at point B. If point P (a bright spot on the screen) is located a great distance from the sources, then it follows that the line segment S1P is the same distance as BP. As such, the line segment S2B is simply the path difference. That is, the small distance S2B is equal to the difference in distance traveled by the two waves from their individual sources to point P on the screen. The logic is as follows:
| |
Assertion
|
Logic/Rationale
|
|
i
|
S2P = S2B + BP
|
See diagram above left
|
|
ii
|
 PS1B = PBS1 PS1B = PBS1
|
If screen is very far away (L >>> y), then lines S1P and BP are ||
|
|
iii
|
S1P = BP
|
If S1P and BP are || and line S1B is perpendicular to BP, then the length BP = length S1P
|
|
iv
|
S2P = S2B + S1P
|
Since S1P = BP, the expression S1P can be substituted into i
|
|
v
|
S2B = S2P - S1P
|
Algebraic manipulation of iv; subtract S1P from each side
|
|
vi
|
S2B is the PD
|
The path difference (PD) is defined as | S2P - S1P |
|
Note that step ii in the logical proof above demanded that an assumption be made: the screen must be very far away compared to the spacing between point P and the central antinodal line. That is, L >>> y. This is an assumption that underlies Young's derivation of his wavelength equation. The equation is only as valid as this assumption is true.
The yellow triangle in the diagram on the left above is enlarged and redrawn in the middle of the graphic. The triangle is a right triangle with an angle theta and a hypotenuse of d. Using the sine function, it can be stated that
sine(Θ) = S2B / d
But since it has been previously stated that the path difference (PD) is equal to the length of the line segment S2B, the above equation can be rewritten as
sine(Θ) = PD / d
It can be further asserted that the pink triangle (∆ S1BS2) and the yellow triangle (∆ ACP) in the diagrams above are similar triangles. To prove that any two triangles are similar, one must show that they have two corresponding angles that are equal. Since the line segment PC was drawn perpendicular to the central antinodal line, it forms a 90-degree angle with the line AC. Thus, the corresponding angles S1BS2 and ACP are equal.
The second set of corresponding angles of equal measure is S1S2B and APC. This can be proven by returning to the assumption that the screen is very far away (L >>> y). Clearly, the lines S1S2 and PC are parallel lines. As such, the diagonal line S2P creates two alternating angles that are equal in measure - that is, S2PC = S1S2B. Since it is assumed that L >>> y, the line segment S2P and AP are roughly parallel to each other and thus make roughly the same angle with the line segment S1S2. With this assumption, it is thus proven that APC = S2PC. Since the S2PC is equal to both S1S2B and APC, it follows that S1S2B = APC. As such, the pink triangle (∆S1BS2) and the yellow triangle (∆ACP) have two corresponding angles that are equal and thus are similar triangles.
If the pink triangle (∆S1BS2) and the yellow triangle (∆ACP) are similar, all corresponding angles are equal in measure, and so S2S1B = PAC. These two angles are labeled as theta in the diagrams above. The use of trigonometric functions allows one to relate the angle theta to the reliably measured distances d, y and L.
|
sine Θ = PD / d
|
|
tangent Θ = y / L
|
The above logic has consistently assumed that the screen upon which the interference pattern is projected is very far away; that is, L >>> y. This is typically the case for visible light interference patterns. In fact, the L value is typically on the order of several meters while the y value is on the order of a couple of centimeters. For such dimensions, the angle theta is less than 1 degree. For such small angles, the approximation that the sine  = tangent can be made. Taking 1 degree as a sample angle, calculated values of the sine and tangent can be compared.
|
sine (1 deg) = 0.017452406
|
|
tangent (1 deg) = 0.017455064
|
Note that the values for the sine and the tangent of 1 degree show agreement out to the fourth significant digit. Since the sine and the tangent of these small angles are approximately equal, we can state that their ratio of lengths (as stated above) is also equal. That is,
PD / d = y / L
In the previous section of Lesson 3, it was shown that the path difference (PD) for any point on the pattern is equal to m • λ, where m is the order number of that point and λ is the wavelength. By substitution,
m • λ / d = y / L
As a final step in the derivation, the equation can be algebraically manipulated so that the wavelength (λ) is by itself:
λ = y • d / (m • L)
As set forth by the derivation above, the wavelength of laser light can be experimentally determined by selecting a point (referred to as point P) on a nodal and antinodal line of known order value (m) and making the following measurements:
- the distance between the slits or sources of the two light waves (d)
- the perpendicular distance from the point P to a point on the central antinodal line (y)
- the distance from point P to the sources (L)
The Importance of Coherent Light Sources
Visible light waves - those that humans can see - have an abnormally short wavelength. For instance, red light has a wavelength of about 650 nanometers. Since there are one billion nanometers in a meter, and one thousand millimeters in a meter, the wavelength of red light is less than one-thousandth of a millimeter. That's a very short wave. And being a short wave, the distance between positions of constructive interference and positions of destructive interference is very small. Thus, the effects of interference for visible light waves are difficult to observe.
Complicating the task of observing the interference of visible light waves is the fact that light from the two sources must be coherent. Two light sources that maintain a constant phase difference with each other are said to be coherent light sources. Light visible to the human eye makes a complete cycle of vibration from crest to trough and back to crest in roughly 10-15 seconds. If we think of a light wave as a transverse wave pattern with crests and troughs, then a crest is typically created every 10-15 seconds. Consider two light sources producing light waves at the same frequency, but one source is creating a crest just prior to the moment in time when the other source is creating a crest. Such light sources are not at the same phase in their cycle of light production. They are said to be out of phase. Yet if they maintain the same difference in phase, they are considered coherent light sources. Even if the sources of light do not stay in step with each other, as long as the amount by which they are out of step remains the same over time, the light sources are said to be coherent.

Typical light sources such as incandescent light bulbs have an intrinsic irregularity associated with the manner in which they produce light. The production of light results when atoms of the filaments or source become electrically excited and produce an electromagnetic or light wave. Since these excitations occur in an unpredictably random fashion, the light waves that they produce do not maintain a constant phase difference with each other. Approximately once every 10-8 seconds, a source will randomly alter its phase. While waves from these sources will interfere to produce an interference pattern, the lack of coherence means that the pattern will constantly change with time. In fact, the patterns change so rapidly with time (once every 10-8 seconds) that there is no possibility that the human eye could ever discern a pattern. To produce a stable and unchanging interference pattern, it is essential that the two sources be coherent.
In this section, the logic and mathematics associated with Young's equation was presented. In the next section of Lesson 3, we will investigate how Thomas Young was able to conduct an experiment with two coherent sources of light in order to make a reliable measurement of the wavelength of light.
We Would Like to Suggest ...

Sometimes it isn't enough to just read about it. You have to interact with it! And that's exactly what you do when you use one of The Physics Classroom's Interactives. We would like to suggest that you combine the reading of this page with the use of our
Young's Experiment Interactive. The Interactive is found in the Physics Interactives section of our website and allows a learner to use a two-point source interference pattern to measure the wavelength of red-, blue- and green laser light.
Check Your Understanding
 1. When determining the wavelength of light, measurements must be made of y, d, m and L. The y value is dependent upon the chosen dark or bright spot and thus the m value. Consider the projected pattern of bright and dark spots on a screen as shown below. For each y measurement, identify the corresponding m value. Then see if you can observe a generality about the relationship between the spacing between adjacent bright spots and the y and m value.
|
Selected Measurement
|
m value
|
|
y1 = 6.4 cm
|
____________
|
|
y2 = 9.6 cm
|
____________
|
|
y3 = 16.0 cm
|
____________
|
|
y4 = 6.4 cm
|
____________
|
|
y5 = 16.0 cm
|
____________
|
2. Young's equation describes the mathematical relationship between wavelength and measurable quantities in a two-point source interference experiment.
λ = y • d / (m • L)
Describe the effect of alterations in d, L and λ upon the spacing between bright spots in a two-point source interference pattern; complete the following statements.
a. Altering the distance between sources (d) by a factor of 2 would cause the y value to ____________ (increase or decrease) by a factor of _____.
b. Altering the distance between sources (d) by a factor of 0.5 (one-half) would cause the y value to ____________ (increase or decrease) by a factor of _____.
c. Altering the distance between the sources and the screen (L) by a factor of 3 would cause the y value to ____________ (increase or decrease) by a factor of _____.
d. Altering the distance between the sources and the screen (L) by a factor of 0.25 (one-fourth) would cause the y value to ____________ (increase or decrease) by a factor of _____.
e. Altering the wavelength of light (λ) by a factor of 1.5 (three-halves) would cause the y value to ____________ (increase or decrease) by a factor of _____.