The Stoplight
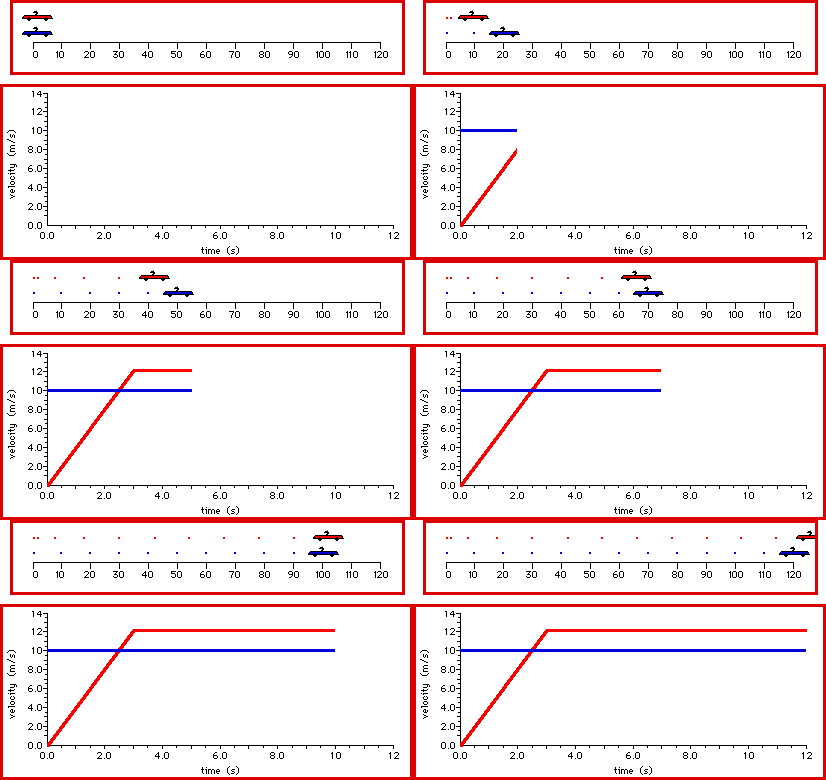
A blue car moving at a constant speed of 10 m/s passes a red car that is at rest. This occurs at a stoplight the moment that the light turns green. The clock is reset to 0 seconds and the velocity-time data for both cars are collected and plotted. The red car accelerates from rest at 4 m/s/s for three seconds and then maintains a constant speed. The blue car maintains a constant speed of 10 m/s for the entire 12 seconds. Observe the motion and make meaning of the accompanying graphs to answer the following questions:
-
What is the final velocity of a car that accelerates from rest at 4 m/s/s for three seconds?
-
What is the displacement of each individual car after three seconds? (Consider a kinematic equation or the area of the velocity-time graph.)
-
What is the slope of the line for the red car for the first three seconds?
-
What is the displacement of each individual car after nine seconds (use the area of the velocity-time graph)?
-
Does the red car pass the blue car at three seconds? If not, then when does the red car pass the blue car?
-
When lines on a velocity-time graph intersect, does it mean that the two cars are passing by each other? If not, what does it mean?

Answers at bottom of page.
For more information on physical descriptions of motion, visit The Physics Classroom Tutorial. Specific information is available there on the following topics:
Ticker Tape Diagrams
Acceleration
Meaning of Slope of Velocity-Time Graphs
Determining Slope of Velocity-Time Graphs
Area of Velocity-Time Graphs
Answers to above questions:
-
12 m/s
-
Red Car: Area of Triangle = 0.5*b*h = 0.5*(3 s)*(12 m/s) = 18 m
Blue Car: Area of Rectangle = b*h = (3 s)*(10 m/s) = 30 m
-
slope = rise/run = (12 m/s- 0 m/s) / (3 s) = 4 m/s/s
-
Red Car: Area of Triangle + Area of Rectangle = 0.5*b1*h1 + b2*h2 = 0.5*(3 s)*(12 m/s) +(6 s)*(12 m/s) = 18 m + 72 m = 90 m
Blue Car: Area of Rectangle = b*h = (9 s)*(10 m/s) = 90 m
-
No! The red car passes the blue car at 9 seconds. See animation and the result of the above question.
-
No! When lines intersect on a velocity-time graph, it means that the two cars have the same velocity. When lines intersect on a position-time graph, it means that the two cars are passing each other.