About the Science Reasoning Center
 Highly Recommended
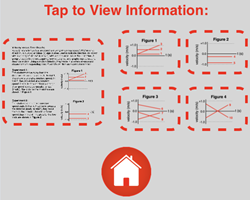
Like all our Science Reasoning Center activities, the completion of the Velocity-Time Graphs activity requires that a student use provided information about a phenomenon, experiment, or data presentation to answer questions. This information is accessible by tapping on the small thumbnails found on the bottom right of every question screen. However, it may be considerably easier to have a printed copy of this information or to display the information in a separate browser window. You can access this information from this page.
The Standards
The Velocity-Time Graphs activity describes four different experiments involving the use of a motion detector and the resulting velocity-time graphs. Ten different types of motion (fast, slow, movement towards and away from the detector, constant speed, changing speed, etc.) are contrasted in the experiments. Students must interpret data, compare and contrast the results of the various experiments, use the results of the experiments to evaluate the validity of a conclusion, identify the supporting evidence for a conclusion, and reason towards appropriate conclusions when given the findings of an experiment.
Success with the activity requires some degree of proficiency or understanding with respect to ...
- Developing and Using Models (Science and Engineering Practice 2.3)
Develop, revise, and/or use a model based on evidence to illustrate and/or predict the relationships between systems or between components of a system. - Using Mathematics and Computational Thinking (Science and Engineering Practice 5.3)
Use mathematical, computational, and/or algorithmic representations of phenomena to describe and/or support claims and/or explanations. - Constructing Explanations and Designing Solutions (Science and Engineering Practice 6.2)
Construct and revise an explanation based on valid and reliable evidence obtained from a variety of sources. - Patterns (Crosscutting Concept 1.5)
Mathematical representations are needed to identify some patterns.
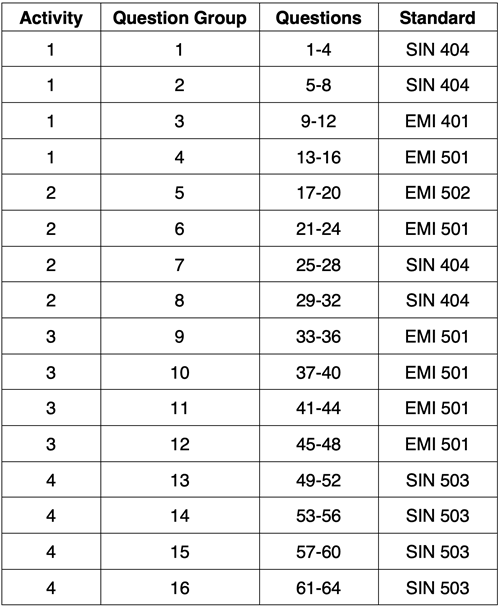
While the Velocity-Time Graphs activity addresses the three NextGen Science and Engineering Practices and the one Crosscutting Concept above, the activity drew its greatest inspiration from ACT's College Readiness Standards for Science Reasoning. The activity consists of 64 questions organized into 16 Question Groups that are spread across the four activities. All three strands (Interpretation of Data - IOD; Science Investigation - SIN; and Evaluation of Models, Inferences, and Experimental Results - EMI) of the College Readiness Standards are addressed in this activity. The code given for the standard includes three letters to indicate the strand and three numbers to indicate the specific standard within that strand. Higher numbers are indicative of more complex science reasoning skills. The relationship between the questions and the standards is as follows:
Complementary and Similar Resources
The following resources at The Physics Classroom website complement the Velocity-Time Graphs Science Reasoning Activity. Teachers may find them useful for supporting students and for crafting lesson plans and unit plans.
The Physics Classroom Tutorial: Kinematics Chapter, Lesson 4
Physics Interactives: Kinematic Graphing Simulation
Physics Interactives: Graphs and Ramp
Minds On Physics, Kinematic Graphing module: Missions KG5 - KG8
Concept Builders, 1-D Kinematics, Velocity-Time Graphs
Calculator Pad, Kinematics, Problem Sets K10 - K12
Recommended: Print Passage, Tables, and Graphs
Also see: