Chapter 2: 1D Kinematics - Lesson 4: Describing Motion with Velocity vs. Time Graphs
Determining the Slope on a v-t Graph
Hold down the T key for 3 seconds to activate the audio accessibility mode, at which point you can click the K key to pause and resume audio. Useful for the Check Your Understanding and See Answers.
 It was learned earlier in Lesson 4 that the slope of the line on a velocity versus time graph is equal to the acceleration of the object. If the object is moving with an acceleration of +4 m/s/s (i.e., changing its velocity by 4 m/s per second), then the slope of the line will be +4 m/s/s. If the object is moving with an acceleration of -8 m/s/s, then the slope of the line will be -8 m/s/s. If the object has a velocity of 0 m/s, then the slope of the line will be 0 m/s. Because of its importance, a student of physics must have a good understanding of how to calculate the slope of a line. In this part of the lesson, the method for determining the slope of a line on a velocity-time graph will be discussed.
Let's begin by considering the velocity versus time graph below.
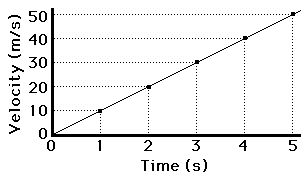
The line is sloping upwards to the right. But mathematically, by how much does it slope upwards for every 1 second along the horizontal (time) axis? To answer this question we must use the slope equation.
Using the Slope Equation
The slope equation says that the slope of a line is found by determining the amount of rise of the line between any two points divided by the amount of run of the line between the same two points. A method for carrying out the calculation is
- Pick two points on the line and determine their coordinates.
- Determine the difference in y-coordinates for these two points (rise).
- Determine the difference in x-coordinates for these two points (run).
- Divide the difference in y-coordinates by the difference in x-coordinates (rise/run or slope).
The calculations below shows how this method can be applied to determine the slope of the line. Note that three different calculations are performed for three different sets of two points on the line. In each case, the result is the same: the slope is 10 m/s/s.
For points (4 s, 40 m/s) and (3 s, 30 m/s):
Observe that regardless of which two points on the line are chosen for the slope calculation, the result remains the same - 10 m/s/s.
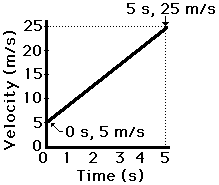
Check Your Understanding
Consider the velocity-time graph below. Determine the acceleration (i.e., slope) of the object as portrayed by the graph. Use the button to view the answer.
We Would Like to Suggest ...
 Sometimes it isn't enough to just read about it. You have to interact with it! And that's exactly what you do when you use one of The Physics Classroom's Interactives. We would like to suggest that you combine the reading of this page with the use of our Two Stage Rocket Interactive. This Interactive is found in the Physics Interactives section of our website and allows a learner to apply the skill of calculating slopes and relating them to acceleration values for a two-stage rocket.