Chapter 2: 1D Kinematics - Lesson 4: Describing Motion with Velocity vs. Time Graphs
Relating the Shape to the Motion
Hold down the T key for 3 seconds to activate the audio accessibility mode, at which point you can click the K key to pause and resume audio. Useful for the Check Your Understanding and See Answers.
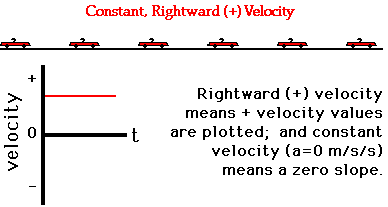
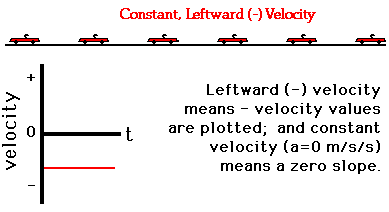
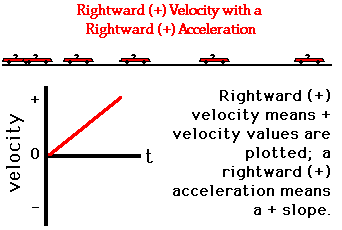
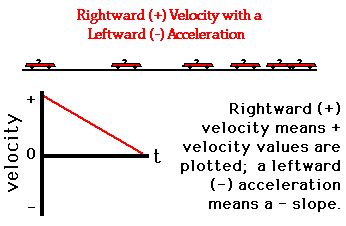
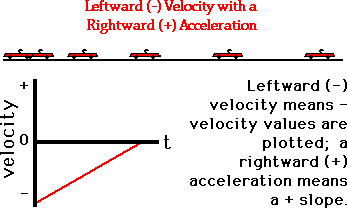
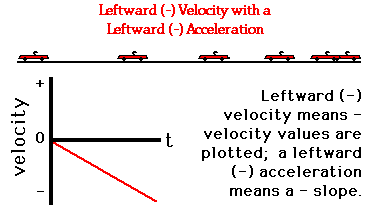
 As discussed in a previous part of Lesson 4, the shape of a velocity vs. time graph reveals pertinent information about an object's acceleration. For example, if the acceleration is zero, then the velocity-time graph is a horizontal line - having a slope of zero. If the acceleration is positive, then the line is an upward sloping line - having a positive slope. If the acceleration is negative, then the velocity-time graph is a downward sloping line - having a negative slope. If the acceleration is great, then the line slopes up steeply - having a large slope. The shape of the line on the graph (horizontal, sloped, steeply sloped, mildly sloped, etc.) is descriptive of the object's motion. This principle can be extended to any motion conceivable. In this part of the lesson, we will examine how the principle applies to a variety of types of motion. In each diagram below, a short verbal description of a motion is given (e.g., "constant, rightward velocity") and an accompanying motion diagram is shown. Finally, the corresponding velocity-time graph is sketched and an explanation is given. Near the end of this page, a few practice problems are given.
Investigate!
Try experimenting with different signs for velocity and acceleration. For instance, try a positive initial velocity and a positive acceleration. Then, contrast that with a positive initial velocity and a negative acceleration.
We Would Like to Suggest ...
 Sometimes it isn't enough to just read about it. You have to interact with it! And that's exactly what you do when you use one of The Physics Classroom's Interactives. We would like to suggest that you combine the reading of this page with the use of our Graph That Motion or our Graphs and Ramps Interactives. Each is found in the Physics Interactives section of our website and allows a learner to apply concepts of kinematic graphs (both position-time and velocity-time) to describe the motion of objects.
 Check Your Understanding
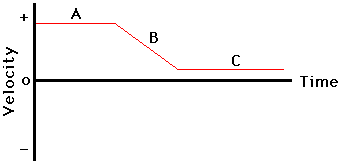
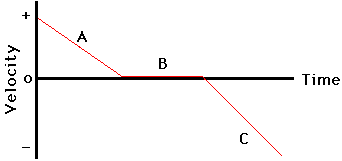
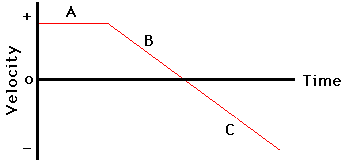
Describe the motion depicted by the following velocity-time graphs. In your descriptions, make reference to the direction of motion (+ or - direction), the velocity and acceleration and any changes in speed (speeding up or slowing down) during the various time intervals (e.g., intervals A, B, and C). When finished, use the button to view the answers.