 Velocity-Time Graphs
Resource:
Science Reasoning Center: Velocity-Time Graphs
Grade Level: High School
Description:
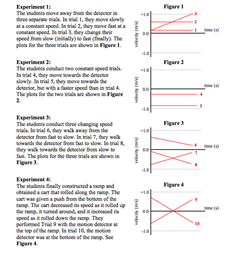
This passage describes four different experiments involving the use of a motion detector and the resulting velocity-time graphs. Ten different types of motion (fast, slow, movement towards and away from the detector, constant speed, changing speed, etc.) are contrasted in the experiments. Questions target a student's ability to interpret data, to compare and contrast the results of the various experiments, to use the results of the experiments to evaluate the validity of a conclusion, to identify the supporting evidence for a conclusion, and to reason towards appropriate conclusions when given the findings of an experiment.
This activity aligns with two of the three dimensions of the Next Generation Science Standards in the manner described below:
| Patterns: Different patterns may be observed at each of the scales at which a system is studied and can provide evidence for causality in explanations of phenomena. |
Making comparisons between trials of data can be a powerful way for students to explore patterns. Through questions posed at the end of this data presentation, the reader is asked to make several comparisons in an effort to understand how velocity vs. time graphs can be used to model and describe the motion of a moving object. As students look for patterns in these data presentations, they are able to construct their own understanding of motion using the velocity vs. time graph model. |
| Analyzing and Interpreting Data: Analyze data using tools, technologies, and/or models (e.g., computational, mathematical) in order to make valid and reliable scientific claims or determine an optimal design solution. |
Having to analyze ten trials found within four velocity vs. time graphs forces students to make claims about the types of motions represented by positive and negative velocities as well as changing velocities. Careful analysis by students in this passage can afford them the skills needed to describe any motion represented on a velocity vs. time graph. |
| Developing and Using Models: Develop and/or use a model to generate data to support explanations, analyze systems, or solve problems. |
Velocity vs. time graphs are one model for describing an object’s motion. As students work through this data presentation and the questions that follow, every data presentation and exercise presented requires them to use a model to support explanations or solve problems. |
| Constructing Explanations and Designing Solutions: Construct and revise an explanation based on valid and reliable evidence obtained from a variety of sources (including students' own investigations, models, theories, simulations, peer review) and the assumption that theories and laws that describe the natural world operate today as they did in the past and will continue to do so in the future. |
As students build their own understanding of the types of motion that can be depicted using the velocity vs. time graphs shown in the data presentations, they are eventually confronted with new situations. Questions 10 and 11 are great examples of how a student must apply what he or she has learned to construct explanations regarding the type of motion represented in a new velocity vs. time graph scenarios. |
Associated Reading from The Physics Classroom
Other Supporting Pages at The Physics Classroom:
- The Curriculum Corner: Kinematics - Describing Motion with Velocity-Time Graphs; Describing Motion Graphically
View Infographic.
(Coming Soon)
Search the NGSS Corner
Maybe you're looking for something really specific that pertains to a desired topic and emphasizes one or more of the listed NGSS dimensions. Why not try a search of this section of our website? Simply select from one or more of the pull-down menus and click Search. This page will reload and a collection of possibilities will be displayed in this section of the page and sorted by relevancy.