Chapter 14: Kinetics and Equilibrium - Lesson 1: Kinetics of Reactions
Reaction Rates
Hold down the T key for 3 seconds to activate the audio accessibility mode, at which point you can click the K key to pause and resume audio. Useful for the Check Your Understanding and See Answers.
The Big Idea
In this lesson we explore how reaction rates are quantified, how concentration-time data can be used to determine a rate, and how rate equations form the heart of chemical kinetics.
What is Chemical Kinetics?
Most people are familiar with the rusting of iron. It is a relatively slow chemical reaction under most conditions, often taking years before the first signs of rusting are evident. The process involves the reaction of iron with oxygen to form iron(III) oxide.
4 Fe(s) + 3 O2(g) → 2 Fe2O3(s)
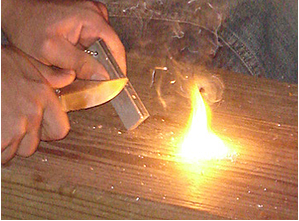 Many Chemistry students are familiar with the combustion of a magnesium ribbon since it is a common classroom demonstration. The process occurs quite rapidly, emitting intense light and producing a white powder. The reaction can be described by the equation:
2 Mg(s) + O2(g) → 2 MgO(s)
These two processes involve the reaction of a metal with oxygen to produce a metal oxide. While there are several differences between the two reactions, the most striking difference is the rate at which they occur. One reaction continues over several years and the other reaction is completed in seconds.
Photo Credit: Wikimedia Commons
Reaction rates are of great interest to chemists and chemistry-related industries. The chemical manufacturing industry often wants a reaction to occur rapidly so that the product is produced and shipped to the customer as quickly as possible. The catalytic converter of a car converts harmful exhaust gases (CO, NO2, NO3) to less noxious forms (CO2, N2) before the exhaust exits the tailpipe. The reaction must take place in a fraction of a second before the exhaust gas exits the converter. Sometimes, chemists wish to slow down the rate of a reaction. Food scientists are on a perpetual hunt for safe antioxidants, preservatives, and enzyme inhibitors that can be added to foods to slow down the rates of spoiling and increase their shelf life. And a pharmaceutical researcher may want a reaction to occur very slowly with the human body, releasing the active ingredients over the course of the day rather than within the first hour.
 The study of reaction rates is known as chemical kinetics. In this Lesson, we will learn about reaction rates and the variables that affect reaction rates. We will learn a model that explains reaction rates. We will learn how studies are conducted to determine the mathematics of reaction rates. Finally, we will learn how reactions take place in a collection of steps and how those steps can be altered to control reaction rates.
Meaning of Reaction Rates
In science and mathematics, a rate refers to how a quantity changes over the course of time. The most familiar rate quantity may be velocity (similar to speed). It is the rate at which a moving object's position is changing. It is a position change divided by a time change. We often express it in units like miles per hour or meters per second.
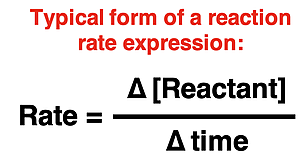
For chemical reactions, the rates refer to how the amount of a reactant or product changes over the course of time. Most commonly, we express the amount as a molar concentration - the number of moles per liter. Thus, a reaction rate can be the change in concentration of either a reactant or a product divided by the time change.
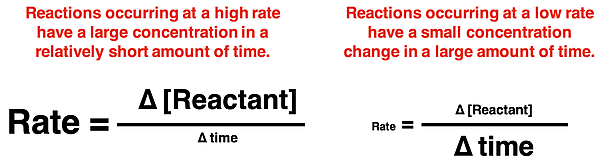
Reaction rates describe the rate at which a reactant (or product) concentration is changing. A high rate or large rate would be characterized as having a relatively large concentration change in a short amount of time. We might describe such a reaction as occuring rapidly. The combustion of magnesium is an example of a reaction that has a large rate. A low or small rate would be characterized as having a relatively small concentration change in a long amount of time. We might describe it as a slow reaction. The rusting of iron would be an example of a low reaction rate.
A High Reaction Rate vs. A Low Reaction Rate
Let's consider the reaction represented by the following equation:

Let's suppose this reaction occurs at a high rate. What would we expect to observe over the course of time? And how would our observations change if the reaction occurred at a low rate? The following particle diagrams contrast a high-rate reaction to a low-rate reaction. The contrast relies on the use of particle diagrams drawn at 100-second intervals of time. In each case, we will say a single particle in a diagram represents 1 mole of that reactant or product and the volume of the container is 1.0 L. This convention allows us to represent the molar concentrations (mol per L or "M") of reactants and products over the course of time. So, in addition to the particle representations, we can view the concentration data ([ … ] = ) at 100 second intervals.
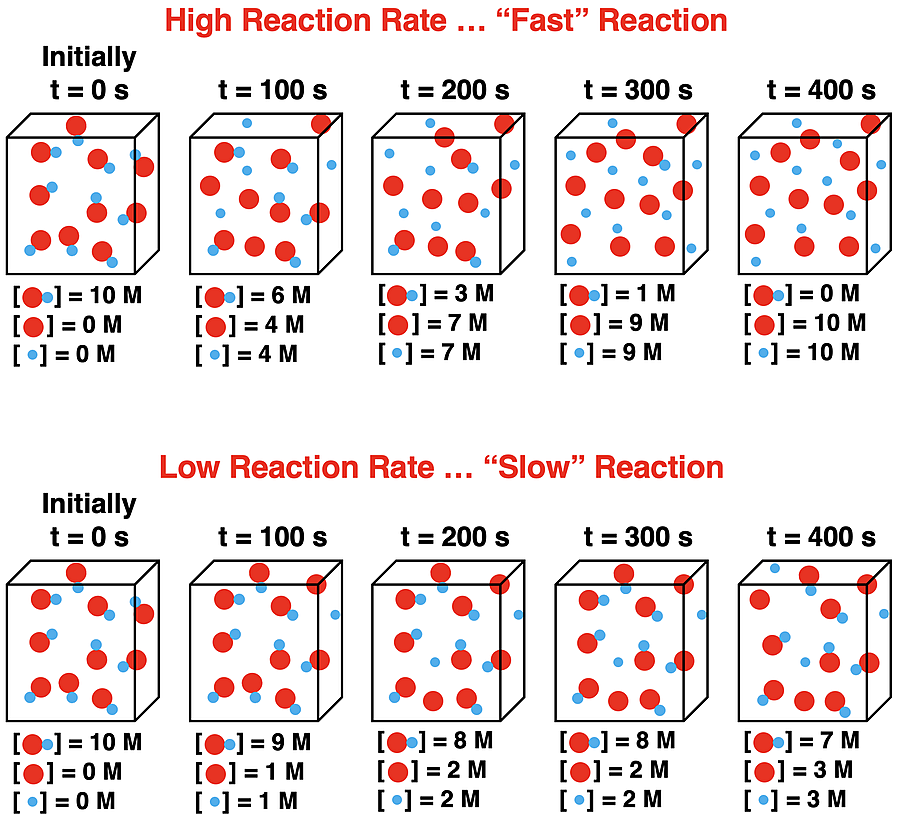
There are some noteworthy points to highlight in this contrast of a high reaction rate to a low reaction rate. They are:
- In each case, the concentration of the reactant decreases with time and the concentrations of products increase with time.
- At a high reaction rate, the reactant concentration changes by -4 M (from 10 M to 6 M) in the first 100 seconds. At a low reaction rate, it would take more than 400 seconds for the reactant concentration to change by -4 M.
- The rate of change in the concentrations is not constant. Consider the high reaction rate case: there is a change in reactant concentration of -4 M in the first 100 seconds; the change is only -1M in the last 100 seconds.
Since the rates of reaction change over the course of time, it is a general practice to pick a specific interval of time during which to calculate the rate. Concentration values at the beginning and end of the time interval can be used to calculate the reaction rates. This is illustrated below for the time interval from 0 to 100 seconds.
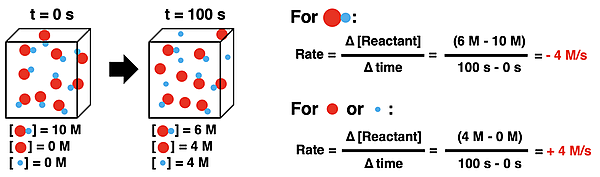
Note that the rate of decomposition of the reactant is a negative value since the change in its concentration is negative (for decreasing concentration). For each of the two products, the rate of production is a positive value since the product concentrations are increasing. The absolute values of these rates are equal in this case; but this is only because the coefficients in the balanced chemical equation are all 1. We will soon see that this will not be the case if the reactants and products have different coefficients. Finally, it is worth noting that the unit "M/s" is a concentration unit divided by a time unit. The unit mol/L/s is equivalent to "M/s".
Analyzing Concentration vs. Time Data
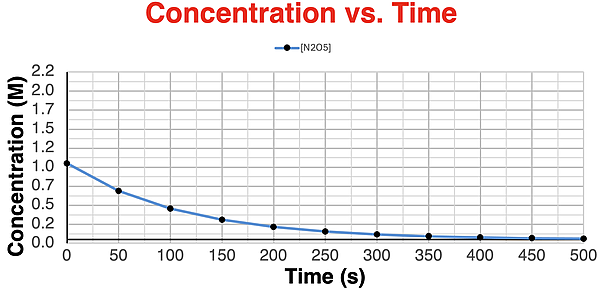
To illustrate the concept of rate, let's consider the decomposition of dinitrogen pentoxide (N2O5) into nitrogen dioxide and oxygen gas:Suppose we start with 0.500 M N2O5 and allow the decomposition to occur over the course of 500 seconds. The concentration-time data and an accompanying plot are shown below.
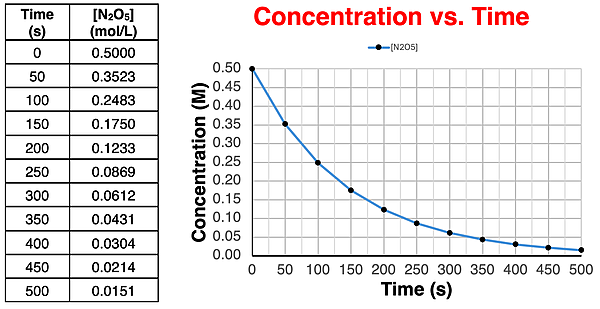
There are a few concepts to highlight from this data. First, the rate of the reaction is changing over the course of time. In the table of data, the change in [N2O5] during the first 50 seconds is -0.1477 M (from 0.3523 M - 0.5000 M). During the last 50 seconds (from 450 s to 500 s), the change in [N2O5] is -0.0063 M (from 0.0151 M - 0.0214 M). The reaction rate is much higher during the early time intervals than the latter time intervals.
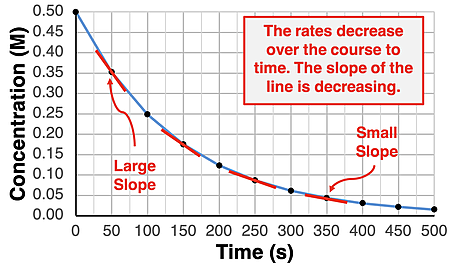 Second, on the plot of concentration vs. time, the slope of the line is changing over the course of time. For any graph, slope is the change in the y-coordinate divided by the change in the x-coordinate. For a concentration vs. time graph, this translates to slope being the change in concentration divided by the change in time. That means that the slope is the rate of reaction of N2O5. Since the slope is changing over the course of time, so is the reaction rate. It is a negative slope, since the reactant concentration decreases and its change is negative. The line starts out steep (large slope) and finishes as a shallow line (small slope).
Third, this data can be used to calculate slope for various time intervals. Here are three example calculations for three different time intervals.
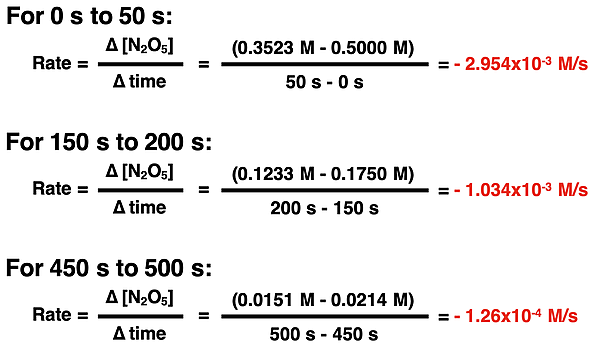
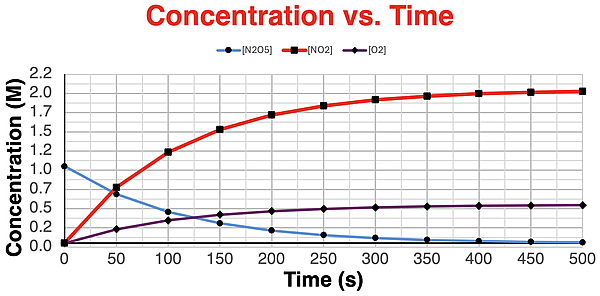
Thus far we have focused on the reactant in this reaction. Let's suppose we also consider data for the two products.
The data table and concentration-time plot for the one reactant and two products are shown below.
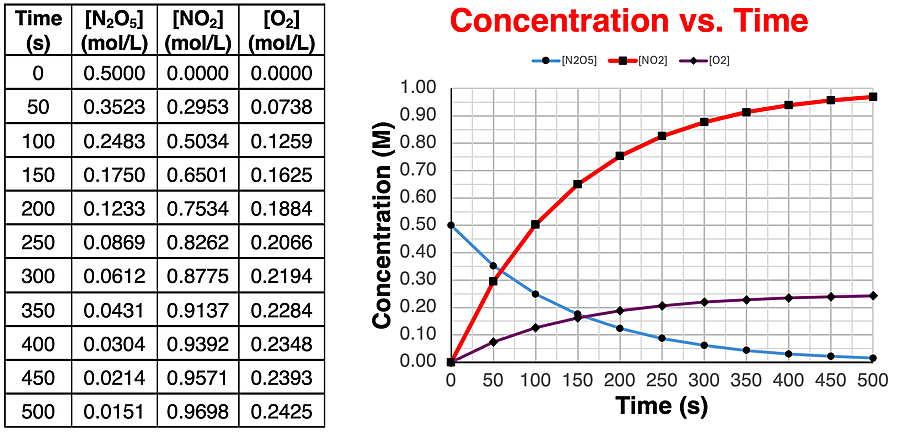
The blue line on the plot is the N2O5; it looks the same as before. The upward-sloped lines represent the two reactants. Observe how the NO2 line has a steeper slope at every instant in time. And observe how the NO2 line rises to a higher concentration. We can attribute these observations to the stoichiometry of the reaction. As the coefficients in the chemical equation indicate: 2 moles of N2O5 decompose to form 4 moles of NO2 and 1 mole of O2. We would expect that the NO2 production rate to be four times greater than the O2 production rate. We can use the values in the data table to do the math. Here's what we find for the reaction rates for the three species involved in the reaction.
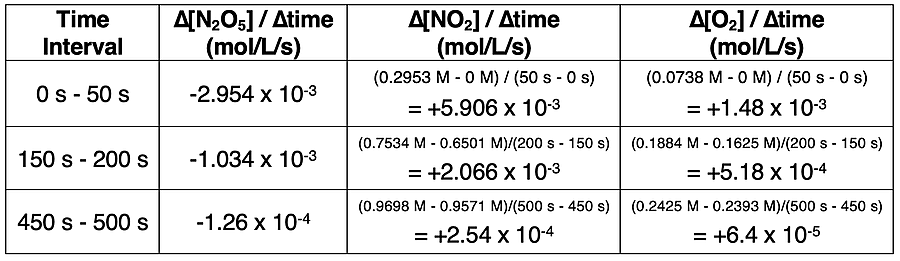
For any of the given times, we observe the following rate relationships between the one reactant and the two products.
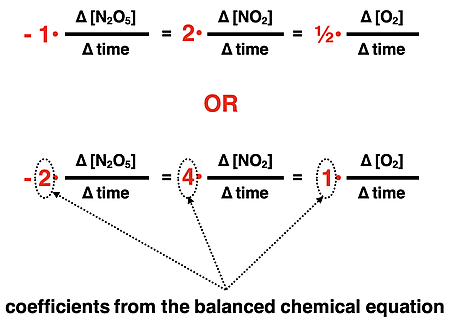
The rate of production of NO2 is two times the rate of decomposition of N2O5. The rate of production of O2 is one-half the rate of decomposition of N2O5. These three rates are related to the coefficients in the balanced chemical equation.
Reaction rates are affected by the concentration of the reactants. As the reactant decomposes, its concentration decreases. This in turn causes the rate of reaction to decrease. In the next part of Lesson 1, we will look in greater detail at the variables (like reactant concentration) that affect the rates of reaction. But before continuing forward, take some time to ensure that you understand by using one or more of the suggestions in the Before You Leave section.
Before You Leave - Practice and Reinforcement
Now that you've done the reading, take some time to strengthen your understanding and to put the ideas into practice. Here's some suggestions.- Our Calculator Pad section is the go-to location to practice solving problems. You'll find plenty of practice problems on our Kinetics and Equilibrium page. Check out the following problem set: Problem Set KE1: Reaction Rates
- The Check Your Understanding section below include questions with answers and explanations. It provides a great chance to self-assess your understanding.
- Download our Study Card on Reaction Rates. Save it to a safe location and use it as a review tool.
Check Your Understanding of Reaction Rates
Use the following questions to assess your understanding of what a reaction rate is. Tap the Check Answer buttons when ready.
1. Give your definition of reaction rate.
2. Is the reaction rate of a reactant equal to the reaction rate of another reactant or of the product? Explain why or why not or when not?
3. Explain with some detail how a reaction with a high reaction rate is different than a reaction with a low reaction rate.
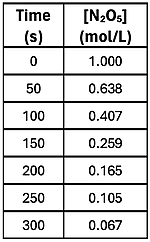 4. Consider the data at the right for the decomposition of N2O5. Use it to calculate the rate of N2O5 decomposition during the following time intervals:
- t = 0 s to t = 50 s Check Answer
- t = 150 s to t = 200 s Check Answer
- t = 250 s to t = 300 s Check Answer
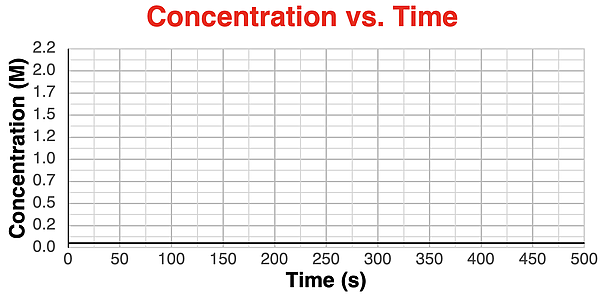
5. (Based on question 5.) The graph below shows the concentration of N2O5 as a function of time for the reaction
2 N2O5(g) → 4 NO2(g) + O2(g).
Sketch the lines for the concentration of NO2 and O2 with respect to time.
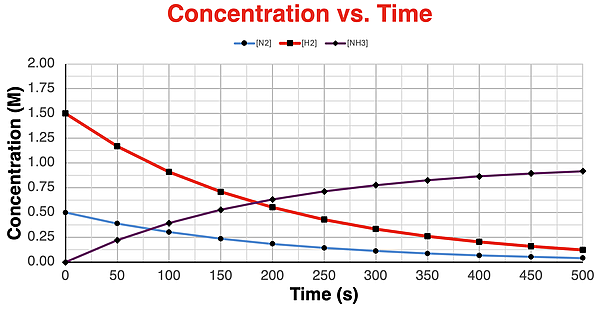
6. Consider the reaction for the synthesis of ammonia.
N2(g) + 3 H2(g) → 2 NH3(g)
Suppose that the reaction begins with [N2] = 0.50 M, [H2] = 1.50 M, and [NH3] = 0 M. Sketch the basic shape of the concentration-time curves on the graph below for all three species in the reaction. Label the curves. (Assume the reaction rate resembles that of all previous reactions that have been shown.)