Lesson 4: Acid-Base Reactions
Part c: Titrations in Chemistry Lab
Part a:
Reactions of a Strong Acid with a Strong Base
Part b:
Neutralization Reactions Involving a Weak Acid or Base
Part c: Titrations
The Big Idea
Titration is a precise analytical procedure in which a solution of unknown concentration (the analyte) is neutralized using a solution of known concentration (the titrant). A critical step is selecting an indicator to signal the endpoint of the titration. Volume measurements, combined with stoichiometry considerations allow one to determine the unknown molarity.
What is a Titration?
Lesson 4a and Lesson 4b discussed acid-base neutralization reactions. One aspect of the discussion involved the stoichiometry of the reaction. The neutralization occurs when the ratio of acid to base equals the ratio of the coefficients in the molecular equation. The acid-to-base mole ratio is often 1: 1 as it is in the reaction between HCl and NaOH:
HCl(aq) + NaOH(aq) → NaCl(aq) + H2O(l)
1:1 Acid-to-Base Mole Ratio
But in the reaction of H2SO4 with NaOH, the acid-to-base mole ratio, the acid-to-base mole ratio is 1:2.
H2SO4(aq) + 2 NaOH(aq) → Na2SO4(aq) + 2 H2O(l)
1:2 Acid-to-Base Mole Ratio
Titration is an analytical procedure that is often used in a Chemistry lab to determine the moles of acid (or base) in a sample of unknown concentration. The procedure is based on acid-base neutralization stoichiometry.
 Let’s suppose we have an acid solution whose concentration we wish to determine. The sample of unknown concentration (in this case, the acid) that is being analyzed is referred to as the analyte. The analyte is titrated with the titrant - a solution of known concentration. A known volume of analyte (acid) is added to a flask. A couple of drops of an acid-base indicator are also added to the flask. A burette is filled with the titrant (in this case, the base). The titrant is slowly added to the analyte. As it is, the neutralization reaction begins but the acid isn’t fully neutralized. When the moles of base added to the flask is finally equal to the moles of acid, a color change is observed. This indicates the endpoint of the titration. The acid-to-base mole ratio equals the ratio of coefficients at the endpoint of the titration. The markings on the burette are used to measure the volume of added base. The moles of base are calculated and the mole ratio is used to determine the moles of acid that were present in the flask. Knowing the moles and the volume of the analyte (the acid), the molarity of the acid is calculated. It’s a common procedure in a chemistry course. Let’s explore how it works.
Equivalence Point vs. Endpoint
 We discussed pH curves for acid-base neutralization reactions in Lesson 4b. They are sometimes referred to as titration curves. The titration curve for the titration of a strong acid (analyte) with a strong base (titrant) is shown at the right. The pH of the contents of the flask as a function of the amount of base added to the flask is plotted. A steep rise in pH occurs near the equivalence point. For this titration, the pH rapidly changes from an acidic level to a basic level. Two points are labeled on the graph. Point A is just prior to the equivalence point; there is more acid present than base in the flask so the pH is less than 7.0 (acidic). Point B is just after the equivalence point; there is more base than acid in the flask so the pH is greater than 7.0. At the equivalence point, the pH is 7.0. Besides the obvious (and rather large) pH difference between points A and B, there is a volume difference of a couple of drops of base.
We discussed pH indicators in Lesson 2c. They change colors over a small pH range. One of the secrets to a well-performed titration is to use an indicator that is a different color for points A and B. An indicator that is yellow at point A and blue at point B will change colors during the couple of drops of base that are added between A and B. Point B is referred to as the endpoint of the titration. The change in color indicates that the endpoint has been reached.
Choosing an Indicator
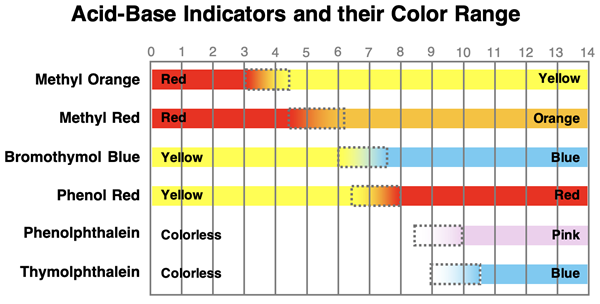
 The best indicator for a titration is one that has a color change range that straddles the pH of the equivalence point. This insures that it is a different color on opposite sides of the equivalence point. For a strong acid-strong base titration, the equivalence point is at 7.0. So an indicator that changes color between a pH of about 6 and 8 will time its color change to match the equivelence point. A list of a few common acid-base indicators and the pH range of their color change is shown below. For the titration curve at the right, bromothymol blue would be a good choice since it changes color between a pH of 6.0 and 7.4. The analyte will be yellow before the equivalence point and blue at the endpoint.
Titration of a Weak Acid with a Strong Base - Indicator Choice
 The indicator that is selected depends on the details of the actual titration (and on what is available). The most important detail is the pH value at the equivalence point. The titration of a weak acid with a strong base will have an equivalence point that is higher than 7.0. A typical titration curve is shown at the right. Let’s suppose that the pH is 9.0 at the equivalence point. The general rule is to select an indicator that has a color change range that straddles the pH at the equivalence point. Given this pH of 9.0, the best indicator is one that changes color between 8.0 and 10.0. From the list of indicators listed above, phenolphthalein would be a good choice for an indicator. It would be colorless at point A (before the equivalence point) and pink at point B. The observance of a permanent pink color in the analyte solution is a signal that the endpoint has been reached and the tiration can be stopped.
Titration of a Weak Base with a Strong Acid - Indicator Choice
 Naturally the choice of indicators will be different when titrating a weak base with a strong acid since the equivalence point will occur below 7.0. But the principle will remain the same - select an indicator with a color change range that straddles the pH at the equivalence point. Suppose that it is known that the pH will be 5.0 at the equivalence point. A suitable indicator would be one that changes color at a pH beetween about 4 and 6. Methyl red would be a great indicator for this titration. The analyte will be orange at point A (before the equivalence point) and red at point B. The observance of a permanent red color in the analyte solution is a signal that the endpoint has been reached and the tiration can be stopped.
How to Perform a Titration
A titration is a precise analytical procedure that requires attention to numerous details. The following step-by-step procedure describes some of those details.
- Clean all glassware - flasks, beakers, burette, funnels, stirring rod, etc. - with deionized water.
- Add a known volume of the analyte to a flask and record the amount. Choose a flask that is large enough to hold both the analyte and the titrant that will be added to it and allows room for mixing the contents by swirling.
- Add 2-3 drops of the selected indicator. Swirl the flask gently to mix the indicator into the analyte. Make a mental note of the endpoint color for the indicator.
- Using a funnel, add 10-15 mL of the titrant to a burette. Hold the burette with both hands, tilt, and slowly rotate it so as to allow the inside walls of the burette to be cleansed by the titrant. Empty a few mL out the bottom of the burette. Slowly empty the remaining titrant solution out the open end and into the sink while rotating the burette to ensure the inside wall is rinsed with titrant solution.
- Secure the burette in the clamp of a burette holder. Use a funnel to add titrant solution to the burette. Get an exact initial reading of the burette volume. It should be close to 0.00 mL, but it does not need to be 0.00 mL.
- Position the flask with the analyte solution on the table below the burette. Slide a piece of white paper under the flask. The white background of the paper will make it easier to detect a color change.
- Turn the valve of the burette to slowly add titrant to the flask. Hold the flask with your right hand and gently swirl to mix the contents. Hold the burette valve with your left hand to control the rate at which titrant is added. During this time, keep careful watch of the color. You will begin to see a temporary endpoint color at the location where the titrant lands; the mixing of the titrant by swirling causes the color to go away. As the endpoint color persists for longer lengths of time, reduce the rate at which you add titrant. The longer it persists, the more you will want to reduce the rate since you know you’re approaching the endpoint. As the endpoint is approached, you will add a drop, swirl, and observe the color. Repeat this drop-swirl-observe process until a faint but permanent color fills the entire flask, indicating that you have reached the endpoint.
- Accurately measure the burette volume at the endpoint.
- Repeat the process for a few trials.
- Clean all glassware when finished. Clean your lab station. Secure the rinsed and empty burette upside down in the burette holder to allow it to dry.
Analyzing the Titration Data
Following the above procedure produces a titration data similar to the table below.
The volume of the titrant (NaOH in the above table) is calculated by subtracting the initial burette reading from the final burette reading. The volume and known molarity of the titrant can be used to determine the number of moles of the titrant:
# moles = volume • Molarity
The coefficients of the balanced chemical equation are used to determine the number of moles of analyte. Once the moles of analyte are determined, the molarity can be calculated. Some labs may require additional or slightly varied calculations. The three examples below provide a sampling of the types of calculations that might be required.
Example 1 - Titration of a Strong Base with a Strong Acid
An aqueous solution of NaOH of unknown concentration is standardized by titration with a 0.525 M solution of HCl. An endpoint is reached after the addition of 37.20 mL of acid to a 50.00 mL sample of the base. Determine the concentration of the NaOH.
Solution
To determine concentration (i.e., molarity) of NaOH, the moles of NaOH in the 50.00 mL sample must be determined. At the endpoint, the moles of HCl is equal to the moles of NaOH. Since the molarity and volume of HCl are known, the number of moles can be calculated. Since the moles of NaOH is equal to the moles of HCl, the moles value can be used to determine the molar concentration. The solution pathway is diagrammed below:
Step 1: Determine the moles of HCl used to reach endpoint.
Moles HCl = (0.03720 L)•(0.525 mol HCl / 1 L ) = 0.01963 mol HCl
(rounding will be done at end of problem)
Step 2: Determine moles of NaOH that reacted with the HCl.
Moles NaOH = 0.01963 mol NaOH (since a 1:1 mole ratio)
Step 3: Determine the molarity of the NaOH solution.
Molarity = (0.01963 mol NaOH) / (0.05000 L) = 0.391 M
(rounded from 0.3906 M)
Example 2 - Titration of a Weak Acid with a Strong Base
A student lab group is using a standardized solution of NaOH (0.391 M) to titrate 25.00 mL of an acetic acid (HC
2H
3O
2) solution. The endpoint is reached after the addition 47.80 mL of the base. Determine the molarity of the acetic acid solution.
Solution
To determine concentration (i.e., molarity) of HC
2H
3O
2, the moles of HC
2H
3O
2 in the 25.00 mL sample must be determined. At the endpoint, the moles of NaOH is equal to the moles of HC
2H
3O
2.
HC2H3O2(aq) + NaOH(aq) → Na C2H3O2(aq) + H2O(l)
1:1 Acid-to-Base Mole Ratio
Since the molarity and volume of NaOH are known, the number of moles can be calculated. Since the moles of HC
2H
3O
2 is equal to the moles of NaOH, the value can be used to determine the molar concentration. The solution pathway is diagrammed below:
Step 1: Determine the moles of NaOH used to reach endpoint.
Moles NaOH = (0.04780 L)•(0.391 mol NaOH / 1 L ) = 0.018698 mol NaOH
(rounding will be done at end of problem)
Step 2: Determine moles of HC
2H
3O
2 that reacted with the NaOH.
Moles HC2H3O2 = 0.018698 mol HC2H3O2 (since a 1:1 mole ratio)
Step 3: Determine the molarity of the HC
2H
3O
2 solution.
Molarity = (0.018698 mol HC2H3O2) / (0.02500 L) = 0.748 M
(rounded from 0.747592 M)
Example 3 - Titration of a Weak Acid with a Strong Base
Acetylsalicylic acid (HC
9H
7O
4) is a monoprotic acid that is the active ingredient in an aspirin tablet. A chemistry class is given a lab to determine the mass of HC
9H
7O
4 in a tablet. Each lab group is given a solution said to have 1 full aspirin tablet dissolved in it. Partners Anna Litical and Noah Formula neutralize the acid by adding 12.50 mL of 0.135 M NaOH to the acid solution. What mass of HC
9H
7O
4 is in the tablet? (Given, the molar mass of HC
9H
7O
4 is 180.16 g/mol.)
Solution
Since the HC
9H
7O
4 is monoprotic, the acid-to-base mole ratio is 1:1. The moles of NaOH, and thus the moles of HC
9H
7O
4, can be determined from the NaOH molarity and volume. Once this moles of HC
9H
7O
4 is known, the molar mass can be used to determine the mass of the HC
9H
7O
4. The solution pathway is diagrammed below:
Step 1: Determine the moles of NaOH used to reach endpoint.
Moles NaOH = (0.01250 L)•(0.135 mol NaOH / 1 L ) = 0.0016875 mol NaOH
(round at end of problem)
Step 2: Determine moles of HC
9H
7O
4 that reacted with the NaOH.
Moles HC9H7O4 = 0.0016875 mol HC9H7O4 (since a 1:1 mole ratio)
Step 3: Use molar mass to determine the mass of the HC
9H
7O
4 in the solution.
Mass HC9H7O4 = 0.0016875 mol HC9H7O4 • (180.16 g) / (1 mol )
Mass HC9H7O4 = 0.304 g HC9H7O4 (rounded from 0.30402 g)
Mass HC9H7O4 = 304 mg HC9H7O4
Before You Leave – Practice and Reinforcement
Now that you've done the reading, take some time to strengthen your understanding and to put the ideas into practice. Here's some suggestions.
- Our Calculator Pad section is the go-to location to practice solving problems. You’ll find plenty of practice problems on our Acids and Bases page. Check out the following problem sets: Set AB10: Titration 1 || Set AB11: Titration 2
- The Check Your Understanding section below includes questions with answers and explanations. It provides a great chance to self-assess your understanding.
- Download our Study Card on Acid-Base Titration. Save it to a safe location and use it as a review tool.
Check Your Understanding of Titration
Use the following questions to assess your skill at planning and analyzing an acid-base titration. Tap the
Check Answer buttons when ready.
1. Consider the reaction:
2 HCl(aq) + Ca(OH)2(aq) → CaCl2(aq) + 2H2O(l)
Complete the following paragraph:
A titration is performed to determine the concentration of a calcium hydroxide solution. A known volume of the Ca(OH)
2 is placed in a flask; it is the ________ (analyte, titrant, solvent). A solution of HCl of known concentration is placed in a burette; it is the ________ (analyte, titrant, solvent). The HCl and Ca(OH)
2 are strong acids and bases; the pH at the equivalence point will be ________ (greater than, less than, equal to) 7.0. The best indicator for this titration would be ________ (methyl orange, bromothymol blue, thymolphthalein). With this indicator, the analyte will change color from _______ (colorless, blue, yellow, red, orange) to _______ (colorless, blue, yellow, red, orange) near the equivalence point. This equivalence point is reached when the moles of HCl added to the flask is ________ (equal to, two times, one-half) the moles of Ca(OH)
2 originally present in the flask.
Check Answer
Answer: Answers in Red
A titration is performed to determine the concentration of a calcium hydroxide solution. A known volume of the Ca(OH)2 is placed in a flask; it is the _analyte_. A solution of HCl of known concentration is placed in a burette; it is the _titrant_ . The HCl and Ca(OH)2 are strong acids and bases; the pH at the equivalence point will be _equal to_ 7.0. The best indicator for this titration would be _bromothymol blue_. With this indicator, the analyte will change color from _blue_ to _yellow_ near the equivalence point. This equivalence point is reached when the moles of HCl added to the flask is _two times_ the moles of Ca(OH)2 originally present in the flask.
OR with options shown:
A titration is performed to determine the concentration of a calcium hydroxide solution. A known volume of the Ca(OH)2 is placed in a flask; it is the _analyte_ (analyte, titrant, solvent). A solution of HCl of known concentration is placed in a burette; it is the _titrant_ (analyte, titrant, solvent). The HCl and Ca(OH)2 are strong acids and bases; the pH at the equivalence point will be _equal to_ (greater than, less than, equal to) 7.0. The best indicator for this titration would be _bromothymol blue_ (methyl orange, bromothymol blue, thymolphthalein). With this indicator, the analyte will change color from _blue_ (colorless, blue, yellow, red, orange) to _yellow_ (colorless, blue, yellow, red, orange) near the equivalence point. This equivalence point is reached when the moles of HCl added to the flask is _two times_ (equal to, two times, one-half) the moles of Ca(OH)2 originally present in the flask.
2. Which of the following is the most important consideration when selecting an indicator for a titration experiment?
- Pick the indicator with the coolest colors (after all, you’ll be looking at it all period).
- Pick the indicator with colors that coordinate best with your outfit (it makes for better selfies).
- Pick the one that is least expensive (there’s no sense paying big bucks for doing a chemistry lab).
- Pick the indicator that shows up the best when added to the solution (it’s no good if you can’t see the color).
- Pick the indicator that changes color at a pH range that is a little above to a little below the equivalence point pH.
Check Answer
Answer: E
We don't mean to deny the importance of those other considerations, but E is the best answer.
3. Vinegar contains acetic acid, a weak acid with the chemical formula HC
2H
3O
2. Burr Rette and Earl N. Meyer are titrating a vinegar solution to determine the concentration of acetic acid in a 25.0-mL sample. They add 26.6 mL of a 0.450 M NaOH solution to the sample to reach a clear endpoint. Determine the …
- … number of moles of NaOH added to the sample.
- … number of moles of HC2H3O2 that were in the sample.
- … molarity of acetic acid in the vinegar solution.
Check Answer
Answers:
Part a: Determine the number of moles of NaOH added to the sample
Moles NaOH = (0.0266 L)•(0.450 mol NaOH / 1 L ) = 0.0120 mol NaOH
(rounded from 0.01197 moles)
Part b: Determine the number of moles of HC2H3O2 that were in the sample.
Moles HC2H3O2 = 0.0120 mol HC2H3O2 (since a 1:1 mole ratio)
Part c: Determine the molarity of acetic acid in the vinegar solution.
Molarity = (0.01197 mol HC2H3O2) / (0.02500 L) = 0.479 M
(note that the unrounded number from Part a is used in the calculation)
(final answer rounded to three sigfigs from 0.4788 M)
4. Jack and Jill Stillupdere, the brother-sister lab group from Mrs. Haber’s Period 2 Chemistry class, are titrating a 30.00-mL sample of HCl using a 0.473 M solution of KOH. They use 35.93 mL of the KOH to reach the endpoint. Determine the …
- … number of moles of KOH added to the sample.
- … number of moles of HCl that were in the 30.00-mL sample.
- … molarity of the HCl solution.
Check Answer
Answers:
Part a: Determine the number of moles of KOH added to the sample
Moles KOH = (0.03593 L)•(0.473 mol KOH / 1 L ) = 0.0170 mol KOH
(rounded from 0.01699489... moles)
Part b: Determine the number of moles of HCl that were in the 30.00-mL sample.
Moles HCl = 0.0170 mol HCl (since a 1:1 mole ratio)
Part c: Determine the molarity of the HCl solution.
Molarity = (0.01699489... mol HCl) / (0.03000 L) = 0.566 M
(note that the unrounded number from Part a is used in this calculation)
(final answer rounded to three sigfigs from 0.566496333 ... M)
5. The relatively high acidity of mustard is due to the presence of acetic acid, HC
2H
3O
2. Lab partners Earl N. Meyer and Florence Flasque are titrating a 3.93-gram sample of mustard using a standardized 0.103 M solution of NaOH. They observe an endpoint after the addition of 21.8 mL of NaOH.
- Determine the moles of NaOH added to the mustard sample.
- Determine the moles of acetic acid originally present in the mustard sample.
- Determine the mass of acetic acid originally present in the mustard sample.
- Determine the percent by mass of acetic acid in mustard.
Check Answer
Answers:
Part a: Determine the moles of NaOH added to the mustard sample.
Moles NaOH = (0.0218 L)•(0.103 mol NaOH / 1 L ) = 0.00225 mol NaOH
(rounded from 0.0022454 moles)
Part b: Determine the moles of acetic acid originally present in the mustard sample.
Moles HC2H3O2 = 0.00225 mol HC2H3O2 (since a 1:1 mole ratio)
Part c: Determine the mass of acetic acid originally present in the mustard sample.
The molar mass of HC2H3O2 is 60.052 g/mol
Mass of HC2H3O2 = (0.0022454 mol HC2H3O2) * (60.052 g HC2H3O2 / 1 mole HC2H3O2) = 0135 g HC2H3O2
(note that the unrounded number from Part a is used in this calculation)
(answer rounded to three sigfigs from 0.13484076 ... g)
Part d: Determine the percent by mass of acetic acid in mustard.
This question is asking what percent of the total mass of the mustard sample is HC2H3O2.
% HC2H3O2 = (mass HC2H3O2)/(mass of mustard sample)•100
% HC2H3O2 = (0.13484076 ... g) / (3.93 g) •100 = 3.43%
(note that the unrounded number from Part c is used in this calculation)
(answer rounded to three sigfigs from 3.4310626 ... %)
Jump to Next Lesson: Predicting and Explaining the Acidity Level of Salts
View: Chapter Contents